Search This Blog

Showing posts with label House Price to Income Ratio. Show all posts

Tuesday, November 5, 2019

The Not So Obvious Real Estate Bubbles

We all know about the high price of real estate in San Francisco and Los Angeles. Both metro areas boast one of the highest Median Home Price to Median Income ratios in the country. In 2018, the ratio for Los Angeles was an eye-watering 9.44 times median income. San Francisco was not too far behind with a ratio of 9.24 times median income. The sheer unaffordability of many homes has spawned a crisis of homelessness in those cities. Even tech workers, whose high wages have pushed up real estate prices in Silicon Valley, are forced to sleep in their cars and vans.

Yet those real estate markets are not technically in a bubble, and their ratios are just a shade over one standard deviation of their historical house price to income ratios. For instance, LA's historical ratio for the past 29 years has been at a lofty 7.11 times income, not too far from the current 9.44 times income. The same holds true for San Francisco. Its historical average is 7.57 versus the current 9.24 times income.

Even the global cities of Miami and New York are well within their historical averages. Miami's affordability ratio for 2018 was 6.06 times income - not far from its historical average of 4.71. New York's affordability ratio for 2018 was 5.25 times income - a shade below its historical average of 5.26 times income.


Median House Price to Median Income Ratios


Metropolitan Area 2018 Mean Std Dev Z Score
Los Angeles-Long Beach-Anaheim, CA 9.44 7.11 2.14 1.09
San Francisco-Oakland-Hayward, CA 9.24 7.57 1.65 1.01
Miami-Fort Lauderdale-West Palm Beach, FL 6.06 4.71 1.54 0.88
New York-Newark-Jersey City, NY-NJ-PA 5.25 5.26 1.17 -0.01


So where are the bubbilicious markets? Where have home prices strayed very far from their historical affordability ratios? Does Midland, TX come to mind? How about Lubbock, TX? Birmingham, AL? All these places had affordability ratios of less than 4 times income in 2018 - below the US national average of 4.13 times income. But all are solidly in bubble land with affordability ratios more than 2 times their historical averages since 1990.

Midland, TX ratio stood at 3.08 in 2018 - almost three standard deviations away from its historical mean of just 2.33 times income. The probability of the ratio going higher is just 0.17%. Lubbock's ratio of 3.03 times income in 2018 is 2.58 standard deviations away from its historical mean of just 2.59 times income, giving an upside probability of 0.49%. Birmingham, AL's upside is slightly better 0.64% because its 2018 affordability ratio of 3.86 times income is 2.49 standard deviations away from its historical mean of 3.34 times income.

 According to data tabulated by Harvard University's Joint Center for Housing Studies, 37 metro areas out of 382 metros are in bubble markets:


None of them, with the exception of San Jose, CA of Silicon Valley, are in obvious real estate bubbles.

Will their affordability ratios normalize or have they reached a permanently higher plateau? Only time will tell. But if they do, the results can be just as catastrophic for the homeowners.

Only three metro areas out of 382 are in a depression. Their affordability ratios in 2018 were way below their historical mean:

  1. Cape Girardeau, MO
  2. Beckley, WV
  3. Decatur, IL
The upside probabilities for these areas? More than 98%.


Source: State of the Nation's Housing, Joint Center for Housing Studies, Harvard University

Tuesday, October 8, 2019

US Home Prices Have Softened Somewhat. How Much Lower Should They Go?

Prices of new homes sold in the US have softened somewhat.


As of August 2019, the average prices of new homes sold in the US have dropped 2.2%, from $323,125 in 2018 to just $316,075 today. Incomes have also risen. We estimate the median household income to be $65,074 in 2019, up 3.0% from $63,179 in 2018 and up 6.44% from $61,136 in 2019. As a result, the house price to income ratio now stands at an affordable 4.86 times income, down from its recent peak of 5.26 times income in 2017.


But house prices are still a long way from affordable. The current house price to income ratio is more than one standard deviation above the long-term mean of 4.23. The same holds true for existing homes and all homes both new and existing.


Home Type 2019 Median Sales Price 2019 Median Household Income (Estimated) 2019 House Price to Income Ratio (HPI) Mean House Price to Income Ratio (Mean HPI)
New Homes $316,075 $65,074 4.86 4.23
Existing Homes $268,513 $65,074 4.13 3.73
New and Existing Homes (Weighted Average) $273,859 $65,074 4.21 3.81


So how much further do home prices have to fall to become affordable at current incomes? About 9.4% for all homes, from the current price of $273,859 to $248,160. The drop in new home prices will have to be even steeper: almost 13%.


Conversely, if home prices remain flat, how much further do incomes have to rise to reach their long-term affordability? For all homes, this is around 10.4%. To afford a new home, incomes have to rise 14.9%.


If incomes rise by the current rate of 3.0% a year, it will take 3-5 years before home prices hit their long-term affordability ratios. If prices continue to drop at the current rate of just 2.0% a year, it will take much longer: 5-7 years.

We could be in for a long wait.

Tuesday, March 20, 2018

How Elevated Are US Home Prices?

How elevated are US Home Prices?

Try very elevated. But not too much. Yet.

Median New Home Prices in the United States have been registering at more than five times the Median Household Income for the past four years. They are almost two standard deviations away from the mean ratio of 4.19 times income - a level which would place the ratio squarely in bubble territory. Right now, there is only a 3.4% probability that the market could go higher, assuming a normal distribution. These levels are slightly above the 5.06 times income ratio at the peak of the last US housing bubble.

Source: St. Lous Federal Reserve

One reason why this bubble hasn't popped yet is that the phenomenon is largely confined to new homes. The median sales price of existing homes have gone up and its house price to income ratio now stands at an estimated 4.01 times in 2017. Elevated for sure, but not quite the euphoric levels of 4.74 times income registered in 2005. Another reason is that sales volumes for new homes represent only 11% of total home sales.

Source: Federal Reserve

Nevertheless, on a blended basis, the ratio of house prices to income stood at an estimated 4.14 times. In contrast, the peak ratio was 4.81 times income in 2005. So the US real estate market has yet to surpass the unaffordability levels of the last housing bubble.


Read:

The US Housing Bubble Has Been Fully Reflated

US House Prices Have Climbed Upwards But So Have Incomes


Friday, February 5, 2016

The US Housing Bubble Has Been Fully Reflated

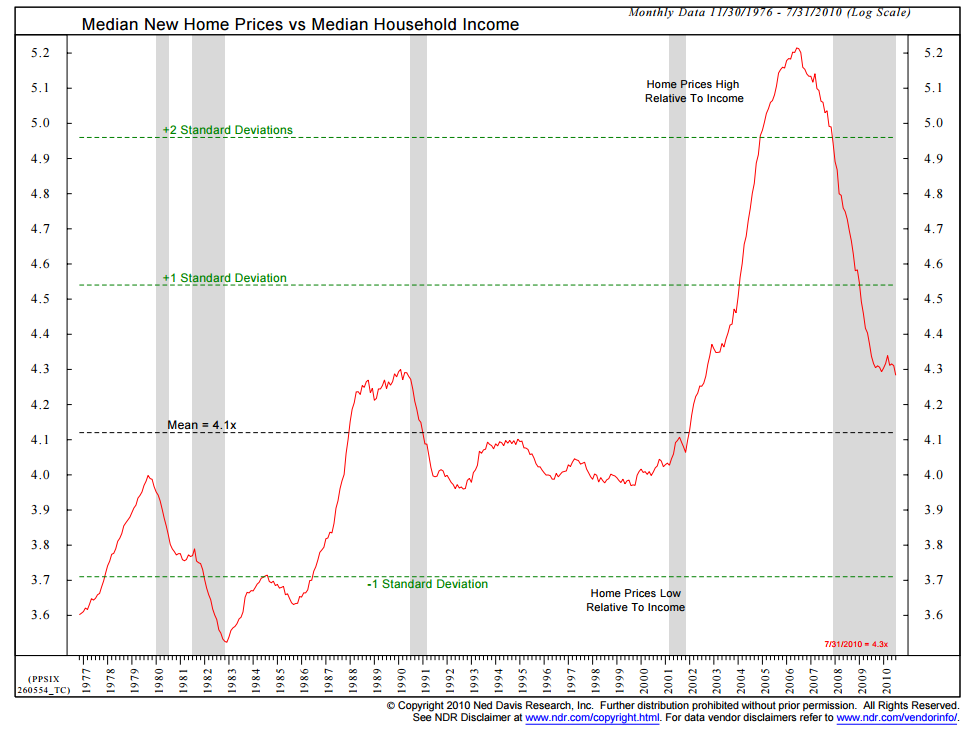
Last week, I came across this chart from Barry Ritholtz's BloombergView column "Confusion About the Financial Crisis Won't Die":


housing


According to Barry Ritholtz:

"the ratio of home prices to income began to tick up in the early 2000s. By 2002, it was approaching its 1980s highs. It was a standard deviation away from the norm by 2004, and it reached at 2 1/2 times the norm in 2005. Housing, as a few of us observed long before the financial crisis bloomed, was a debacle about to happen.
 The housing boom drove employment in construction, mortgage brokerage, home furnishings and durable goods. We even had a bull market in real-estate agents. People pulled cash out of their homes at furious rates to fund renovations at first, then big-screen televisions, automobiles and vacations. The broader way to understand this is that wages were stagnant, inflation was starting to rise and rather than accept a drop in living standards, people used home equity to maintain consumption."

I noticed that the chart from Ned Davis Research only covered the period from 1977 to 2010. Home Prices, as indicated by the S&P/Case-Shiller 20-City Composite Home Price Index, have increased substantially since then.


So what does an updated version of the Ned Davis Research Chart look like right now? It looks like this:


The ratio of Median New Home Prices to Median Household Income has surpassed the highs of the last housing bubble and is once again more than two standard deviations above the norm - clearly unsustainable.  Housing is once again a debacle waiting to happen.