Search This Blog

Tuesday, March 20, 2018

How Elevated Are US Home Prices?

How elevated are US Home Prices?

Try very elevated. But not too much. Yet.

Median New Home Prices in the United States have been registering at more than five times the Median Household Income for the past four years. They are almost two standard deviations away from the mean ratio of 4.19 times income - a level which would place the ratio squarely in bubble territory. Right now, there is only a 3.4% probability that the market could go higher, assuming a normal distribution. These levels are slightly above the 5.06 times income ratio at the peak of the last US housing bubble.

Source: St. Lous Federal Reserve

One reason why this bubble hasn't popped yet is that the phenomenon is largely confined to new homes. The median sales price of existing homes have gone up and its house price to income ratio now stands at an estimated 4.01 times in 2017. Elevated for sure, but not quite the euphoric levels of 4.74 times income registered in 2005. Another reason is that sales volumes for new homes represent only 11% of total home sales.

Source: Federal Reserve

Nevertheless, on a blended basis, the ratio of house prices to income stood at an estimated 4.14 times. In contrast, the peak ratio was 4.81 times income in 2005. So the US real estate market has yet to surpass the unaffordability levels of the last housing bubble.


Read:

The US Housing Bubble Has Been Fully Reflated

US House Prices Have Climbed Upwards But So Have Incomes


Sunday, March 18, 2018

Philippine Residential Sales Volumes Flattened in 2017. Could House Prices Do the Same?

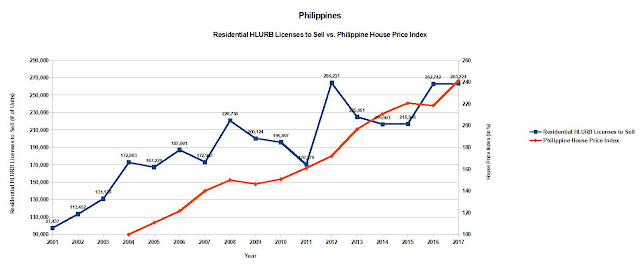
In 2017, HLURB Licenses to Sell volumes grew by only 0.18% to reach 263,224 units. Last time this happened (2014 to 2015), house prices dipped very slightly (by 0.94%) the following year (2016). Will house prices do the same in 2018?

Thursday, March 15, 2018

The American Rate of Growth

The economic recovery of the Great Recession has been almost imperceptible to most Americans. On a per capita bais, real GDP per Capita grew by 7.11% in the past ten years - or roughly a compounded annual average growth rate of only 0.69% per annum. This is far less than the so-called "Hindu Rate of Growth" threshold of 1.30% per annum.  This growth rate is so slow that it is almost imperceptible.


 Sometime in 2018, if growth rates continue their current trend, something extraordinary will happen. Those who survived the Great Depression in 1940 (eleven years after the onset of the Great Depression) will be substantially better of than the survivors of the Great Recession in 2018. Real GDP Per Capita for Great Recession survivors would have grown by another anemic 0.69% per annum in 2018. But for survivors of the Great Depression era, their incomes per capita would have grown by an astounding 7.75% in just one year. Moreover, that trend will only accelerate in the next three years. By 1943, Great Depression survivors will be almost 56%  richer than they were in 1940.

Can we expect the same for survivors of the Great Recession in the next three years? It's possible but not probable.

Thursday, March 8, 2018

How Dividend Policy Has Hampered PLDT and Globe Telecom's Ability to Meet Market Demand - Or Why We Can't Have a Nice Internet

Much has been said about how slow and expensive the Internet is in the Philippines. Internet activists like to blame IP Peering. The telcos themselves say that the process of putting up cell towers is very slow and full of red tape.

Dividend Policy:

But there is another reason why the telcos have not kept pace with market demand: They take out all the money they make and then some.

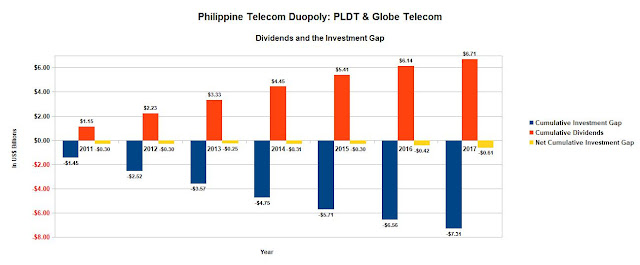
From 2011 to 2017, the duopoly made Php 274.86 billion (roughly US$ 6.16 billion during the same period) but dividended out to its commons shareholders approximately Php 298.71 billion (roughly US$ 6.71 billion) over the same time period, resulting in an overall dividend payout ratio of 108.68%. This dividend payout ratio is more consistent with that of a cash cow being milked than that of a fast growing company seeking to reinvest its profits to build up its business. The chief culprit was PLDT which paid out Php 228.28 billion in dividends during this period, which is 118.59% more than its Php 192.50 billion in net income over the same time frame. Yes, Globe Telecom had a lower dividend payout ratio - but only slightly. It paid out Php 70.43 billion or 85.51% of its Php 82.36 billion in net income.

Source: PLDT & Globe Telecom Financial Statements

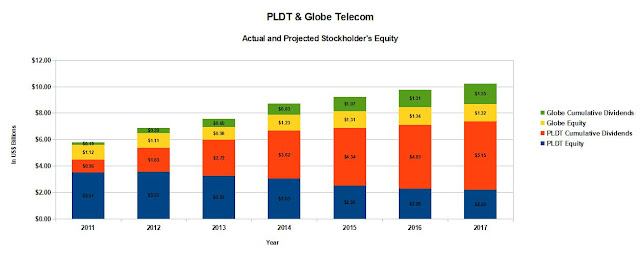
As a result, their combined Total Stockholder's Equity base has gone down instead of up. Since 2011, Total Stockholder's Equity of the two telcos has gone down 11.34% to Php 177.56 billion as of 2017 from Php 200.26 billion as of year-end 2011.


The decline was due to PLDT. Its equity base went down 26.89% from Php 151.83 billion in 2011 to just Php 111.00 billion six years later. In contrast, Globe Telecom's equity base went up by 37.44% during the same period to reach Php 66.57 billion in 2017.

Exploding Internet

This "harvesting" of dividends took place at a time internet penetration rates exploded. From 2011 to 2016, Internet penetration per 100 persons almost tripled from 1.88 to 5.46.


Source: World Bank


More and more people experienced the internet through their mobile phones rather than fixed lines.


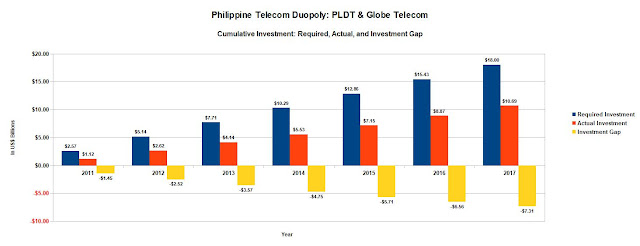
Naturally, the exploding demand for internet required massive investments in broadband infrastructure, which the telcos failed to provide. Edgardo Cabarios, the director of the Regulation Branch of the National Telecommunications Commission (NTC) said that the country needed to invest "Php 800 billion (US$ 18 billion) on its broadband infrastructure but the private sector is only investing Php 60 to Php 70 billion (US$ 1.4 to US$ 1.6 billion) a year."

Given that the life-cycle of internet communications technologies is at most seven years (and may be even faster), this investment translates to a required investment per year of US$ 2.57 billion a year. What the telcos actually spent fell far short of that. They were under-investing to the tune of over US$ 1.0 billion a year.


This gap between the required actual investment is real, cumulative, and growing. If the required capex had begun in 2011 (and there is no reason not to believe that given the rapid propagation of smartphones since 2007 and the global commercialization of 4G LTE technology in 2009), the telcos spent a total of US$ 10.69 billion or US $ 7.31 billion short of the required US$ 18.00 billion investment.


 Much of this investment gap could have been eliminated from the get go had the telcos been less "extractive". The dividends distributed to shareholders is almost a mirror image of the investment gap the telcos faced. Had the telcos plowed their earnings back into their companies, the cumulative investment gap would be a paltry US$ 0.61 billion today. This is an amount they could have easily raised from borrowings because their equity base would have been almost three times larger than it is today.



Wednesday, March 7, 2018

Singapore Breaks its Controlled Slide of House Prices While Philippine House Prices Hit New Highs in 2017 Q4

Almost all countries discussed in this blog post, with the exception of Thailand, have been experiencing rapid growth in home prices that have outstripped inflation by a wide margin.  The gap between home prices and their inflation adjusted levels are at the widest ever, particularly in Singapore, Hong Kong, and the Philippines.

Singapore

Singapore's home prices which have been declining for fourteen straight quarters, have resumed their upward trend. Home prices have rebounded by 1.51% off the low of 166.15 as of the second quarter of 2017. Howevery, home prices are still  68.66% above their year-end 2004 levels. Overall prices levels, as measured by inflation have just increased by 29.67% since year end 2004.  In other words, for the past ten years, Singaporean home prices have outpaced inflation by almost than 40 percentage points.


 Malaysia


Neighboring Malaysia's House Price Index now stands at 267.28 as of the third quarter 2017, 167.28% higher than year-end 1998 levels.  General price levels as of the third quarter 2017 are only around 53.54% higher than their year-end 1998 levels.


 Thailand

 Thailand's home prices have still not kept up with inflation. As of the fourth quarter of 2017, home prices are just 19.22% above their year-end 2004 levels, while the inflation index is 34.99% above its year-end 2004 levels.


Indonesia 

Meanwhile, in Indonesia, home prices have shown no signs of slowing down their upward trajectory. In fact, prices are now at 150.44 as of the fourth quarter of 2017 or 50.44% above their first quarter 2001 levels. Inflation, however, has marched higher. General prices are 82.71% above their first quarter 2007 levels. House prices, therefore, have lagged inflation by 32.27%.


 Philippines

Philippine house price index stands at 241.08% as of the fourth quarter 2017 or over 141.08% above their year-end 2004 levels.  Philippine home prices have posted one of the largest 10 year gains among all the countries considered in this blog post.  Philippine home prices have outstripped inflation by over seventy percentage points.  General prices stood at 168.54% or 68.54% above their year-end 2004 levels. Like Indonesia, Philippine home prices have so far no signs of slowing down their upward trajectory for the foreseeable future.   The question is, is this momentum sustainable?  Or will the Philippines and Indonesia follow its ASEAN neighbors, Singapore, Malaysia, and Thailand, in exhibiting plateauing or declining house prices?  That remains to be seen.