Search This Blog

Tuesday, June 28, 2016

8990 Holdings Inc.'s Impaired Installment Contracts Receivable (ICRs): The Pig Has Finally Broken Out of the Python!


For the past two years, we have noted the sharp uptick in delinquencies in installment contracts receivables (ICRs) in 8990 Holdings Inc. (otherwise known by its ticker: HOUSE).

In 2014, in a post entitled "Has the Philippine Real Estate Bubble Already Burst?", we noted a very sharp uptick in HOUSE's ICRs that were over 90 days past due.  The marked change was very evident during the period from December 31, 2012 to September 30, 2013.


Impairments of these past due receivables were minimal, climbing from an absolute zero in 2012 to just Php 7.2 million in 2013 or a negligible 0.07% of 8990's total ICR portfolio.

Shortly after that post was published, those past due ICRs mysteriously disappeared in the company's audited 2013 Annual Report (See  8990 Holdings, Inc.: The Case of the Disappearing Past Due Installment Contract Receivables).  ICRs that were over 90 days past due dropped from a reported Php 236.0 million as of the September 30, 2013 (Unaudited Interim Report) to just Php 16.0 million as of December 31, 2013 (Audited Annual Report).

Those disappearing past due ICRs miraculously reappeared in the 2014 Annual Report, when HOUSE report that Php 177.4 million or 1.26% of its ICRs were over 90 days past due (See: "The Philippine Real Estate Bubble Has Already Burst for HOUSE (8990 Holdings, Inc.)".

These are the money shots:


Impairments showed "hockey stick"-like exponential growth, jumping from just Php 7.2 million or 0.07% of Total ICRs in 2013 to Php 1.4 billion or a staggering 9.84% of Total ICRs as of year-end 2014.
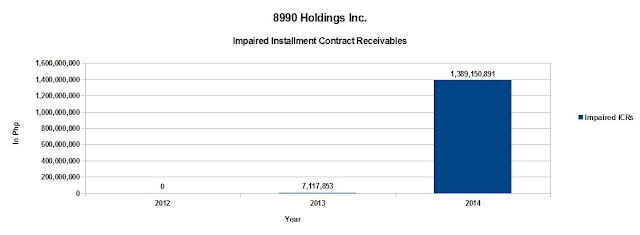


Today, the pig is out of the python.  The "pig" of Impaired ICRs has almost doubled to more than 18.14% of the total ICR portfolio (the python).


But ICRs that are over 90 days past due has dropped considerably from Php 177.4 million or 1.26% of total ICRs in 2014 to just Php 100.6 million in 2015 or 0.53% of total ICRs in 2015.  This could mean that the pipeline of incoming impairments (meaning 90-day past due ICRs) may have stalled or even dropped.


This could mean that 8990 now has a better handle on screening its customers for credit worthiness.  It could also mean that the Philippine real estate market has stabilized.  Volumes for the overall market have remained stable and home prices have continued their upward trend.


Socialized housing, the market space where 8990 predominantly operates has also done well in 2015.  So this could be a factor as well.


8990 remains heavily exposed to areas outside Metro Manila.  Over 50% of its ICRs are in Davao and Cebu.  Exposure to the Metro Manila market is minimal, only 2.11% of ICRs are originated in Metro Manila.


And that could be a good thing.


Source: 8990 Annual Reports, 2012 to 2015; HLURB, edge.pse.com.ph

Friday, June 17, 2016

Construction Gross Value as a Percentage of GDP Is Near a 25 Year High! - Updated as of 1st Qtr. 2016

Last May 4, 2015, we noted that Construction Gross Value (Construction GV) at 11.21% as of the year-end 2014 was already well above its historical average of 9.59% of GDP since 1990.  This ratio has run at an above average rate since 2009 and has already eaten away at the "cumulative underhang" or underinvestment in construction that has taken place since 2004, when the excessive investment in construction that took place in the mid to late 1990's was being absorbed.


As of the 1st Qtr of 2016, Construction GV as a percentage of GDP now stands higher at 11.27% of GDP - near an all-time high for the past 25 years.  But the real story is that Cumulative Construction GV has gone well above equilibrium and now stands at 2.5% above equilibrium, a rise of 1.6% in just a little over one year.  Given all the planned new projects that are already at the execution stage, the momentum in Construction Investment will continue.


Friday, June 10, 2016

How low can Hong Kong Property Prices Go? Some Clues from the Not Too Distant Past.

Last January 8, 2016, in a post titled "Singapore, Malaysia, and Thailand Post Flat to Declining Housing Prices, Can the Philippines and Indonesia be Not Far Behind? - 2nd Qtr 2015", we showed the remarkable run-up in housing prices in Asia, often outpacing inflation by a wide margin.  One of the countries featured was Hong Kong, whose real estate prices have jumped by 234.46% in a little over ten years, outpacing inflation by a staggering 207.16% as of the second quarter of 2015.


Little did we know that property prices peaked a quarter later, in the third quarter of 2015.  Since then, Hong Kong property prices have entered a correction phase, dropping by 10.12% in the two quarters since then.


When we go back to charts with historical data dating back to 1980, we find that such corrections can sometimes presage a bear market in properties. The last major bear market started in October 1997, several months after Hong Kong was handed over back to China from the U.K., lasting an arduously long 69 months or almost six years.  During this phase, prices dropped a gut-wrenching 66.22% in all classes, dipping below their inflation-adjusted levels for two quarters in 2003.  The bear market took place during the financial contagion that occurred during the Asian Financial Crisis.


Unsurprisingly, the last correction took place amid the Global Financial Crisis of 2008.  The correction was short, lasting a mere seven months, from June 2008 to December 2008. Property prices for all classes dropped 17.22% - or almost a bear market (20% decline).

Hong Kong Property Price Indices are broken down by property class.  Property classes are defined by the property's area.
  • Property Class "A": Area below 40 sq. m.
  • Property Class "B": Area between 40 sq. m. and 69.9 sq. m.
  • Property Class "C": Area between 70 sq. m. and 99.99 sq. m.
  • Property Class "D": Area between 100 sq. m. and 159.9 sq. m.
  • Property Class "E": Area above 160 sq. m.

Here's an annual chart of the various Hong Kong Property Price Indices by property class:


Here's the same chart on a monthly basis:


    As evidenced by the chart below, the largest price run-up and decline in the last decade have taken place in the smaller property classes - the A,B, and C Property Classes.  Class A properties have risen the most, rising by a staggering 225.19%.  In the three bull markets prior to that, it was the largest property class, Class E - with areas above 160 sq. m., that have risen the most.  The smaller property classes lagged behind,


    A similar dynamic has taken place in the recent market decline.  It was the Class A properties that declined the most, followed by the bigger property classes. With the exception of the period from October 1997 to July 2003, the smaller property classes were more stable.


    This is born out by the historical price volatility of each property class, as demonstrated by the chart below: 


    The recent large price swings for the smaller property classes have been outside recent historical norms.  


    As seen in the chart above, there were quite a few times when the annual change in the property price indices was more than two standard deviations beyond the mean, the most recent being in 2010 when the A Class posted an annual gain of 26.77%. Under a normal probability distribution, this does not happen 95% of the time.

    These smaller properties are generally held by small retail investors who tend to purchase properties for their own use.  As a result, volatility is usually lower among the smaller property classes. The large run-up and decline in these smaller property classes in recent times indicates that the buying was driven by rampant speculation rather than real consumption.  And that always ends badly.

    So, how low can Hong Kong property price indices go? Your guess is as good as ours.  But given the spectacular price increases from December 2008 to September 2015, it wouldn't be beyond us to think that the prices could revert back to their inflation adjusted levels as they did in the aftermath of the Asian Financial Crisis (October 1997 to September 2003), declining by more than 60% across all property classes.