Search This Blog
Tuesday, September 24, 2019
Australia Has Been Deleveraging Since Year-End 2016
Australia has been deleveraging since year-end 2016. The gap between Credit -to-GDP Growth and its long-term trend has been growing wider ever since. Last time this happened was in March 2010 and it remained that way for over five years - June 2015.
Source: https://www.bis.org/statistics/c_gaps.htmg
Saturday, September 21, 2019
Unemployment is Low But Wage Inflation is Low Too. Which States Have the Tightest Labor Markets?
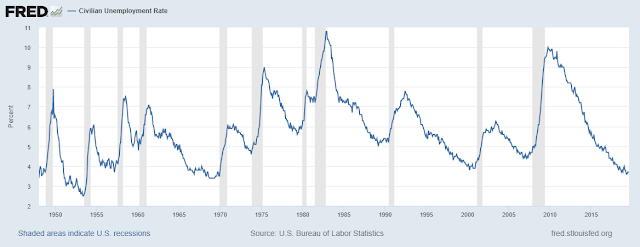
Last month, the unemployment rate was an astounding 3.7% - a rate not seen since September 1969.
But for most of the last decade, wage inflation has been low to almost non-existent. Only recently have wages started to creep up.
One reason? Both the Civilian Labor Force Participation Rates (LFPR) and Civilian Employment to Population Ratios (EPR) have yet to reach their pre-recession peak in 2007 and their absolute peak in 2000, during the height of the dotcom bubble.
The gaps are substantial, involving millions of missing workers. For instance, if last month's LFPR were 65.70% (2007 pre-recession peak) instead of an actual 63.20%, there would be 6.5 million more workers counted in the labor force today.
If we had posted an EPR of 63.00% (2007 peak) instead of the current 60.90%, there would be 5.6 million more workers employed today.
Instead, all those workers have gone missing from the labor force. One reason why wage inflation has not been stronger is that all these missing workers are slowly starting to come back to the labor force and kept a lid on wage inflation.
But that is starting to change. Some states have reached, if not surpassed, their pre-recession LFPRs and EPRs and are starting to experience a shortage of workers.Where are those shortages? DC and Massachussets come to mind (in green). Thirteen other states (in yellow) are getting close, with less than 2% of their civilian non-institutional populations (CINP) labeled as missing. Sadly, five states (in red) have more than 5% of their workers categorized as missing from the labor force.
In terms of EPR, DC and MA have actual shortages (in green) while six other states have less than 2% of their CINPs categorized as missing (in yellow). Seven states have more than 5% of their CINPs categorized as missing.
If you add the percentage of missing workers to the state's unemployment rate, we get a closer picture of where the true unemployment rates lie. Again, DC and MA (in green) have very low true unemployment rates, while four other states (in yellow) have true unemployment rates of less than 5%. Seven states (in red) have true unemployment rates of 12% or more of their CINPs.
Monday, September 16, 2019
Both China and Hong Kong Just Started Deleveraging - Last Year
Credit to GDP growth has dipped below the trendline for both countries.
Source:
https://www.bis.org/statistics/c_gaps.htm
Source:
https://www.bis.org/statistics/c_gaps.htm
Thursday, September 12, 2019
This is Even Nuttier! When's the Crash? Philippine Home Prices Have Gone Even More Parabolic!
Philippine Home Prices have gone parabolic. Home prices are now 125.63% above their inflation-adjusted basis.
On a year-over-year basis, home prices have increased almost 20% year-on-year since the second quarter of 2018. Since the third quarter of 2016, home prices have climbed 43.39%. This pace is unsustainable and will not last.
On a year-over-year basis, home prices have increased almost 20% year-on-year since the second quarter of 2018. Since the third quarter of 2016, home prices have climbed 43.39%. This pace is unsustainable and will not last.
Thursday, September 5, 2019
Hong Kong House Prices Haven't Budged - Yet
But the data is only up to the second quarter of 2019. And the protests only started on a massive scale in the middle of June 2019.
Source: Hong Kong Rating and Valuation Department
Subscribe to:
Posts (Atom)


