Search This Blog

Friday, September 26, 2014

Another Sign that the Philippine Real Estate Bubble May Have Already Peaked?

In a technical analysis of the price trends of financial securities, volume is a very important technical indicator. If the volume moves with the trend, the volume confirms the trend.  When price and volume diverge, it is often indicative of a shift in the trend. For example, if an uptrending stock price is accompanied by lower and lower volumes, it may indicate that the price trend is weak and that prices may start to decline.

The same holds true for the real estate market.

US Real Estate Market

In the US, sales volumes peaked for US Total Home Sales (New and Existing Home Sales) at 8,4 million homes in 2005, a year before the US Median Sales Price peaked at US$ 225K in 2006.  By 2007, the US Median Sales Price slipped by only 1% to US$ 223K while sales volumes had already dropped an astonishing 30.58% from the peak sales volume in 2005, to 5.8 million in 2007.

From then on, the US Median Sales Prices continued to decline year after year, bottoming out at $170K in 2011, or some 25% below the peak price level.  By then sales volumes had already bottomed out a year earlier in 2010 to 4.5 million homes, or some 46% below peak volumes.


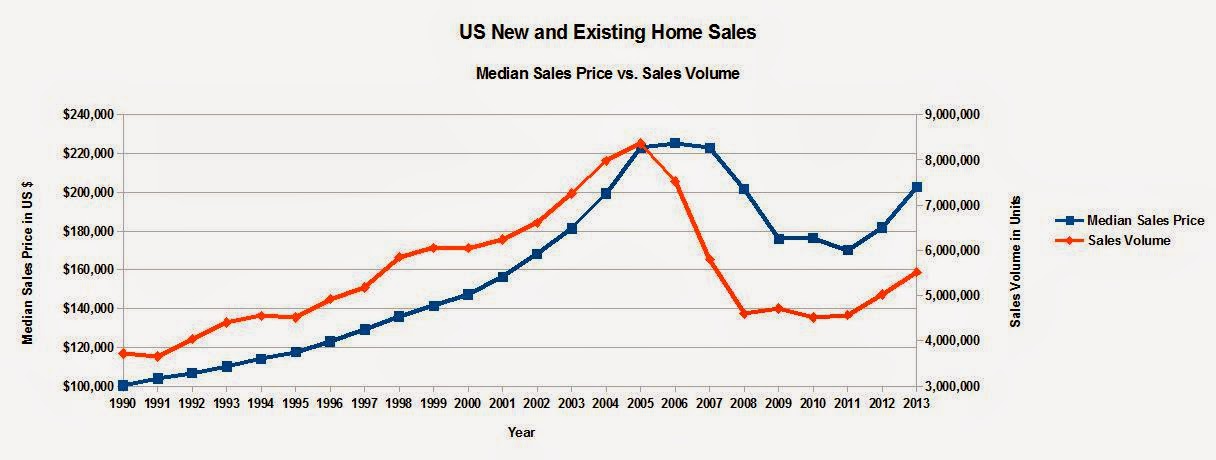
Sources: Realtor.org, St. Louis Fed
Median Sales Price is a weighted average of the median sales prices of New Home Sales and Existing Home Sales


The same dynamic played out in both segments of the US Residential Real Estate Market: New Home Sales and Existing Home Sales.

Here is the chart for New Home Sales:


And here is the chart for Existing Home Sales, the much larger market segment.


Philippine Real Estate Market

Might the same dynamic be playing out in the Philippine residential real estate market?  One problem bedevilling such an analysis is the dearth of data.

To my knowledge, the Philippines does not have adequate market data.  For instance, there seem to be no published figures for sales volumes for residential homes.  The best approximation of such data is HLURB's statistics for licenses to sell residential homes.  This statistic represents only new homes and only represents licenses to sell for each residential unit and not the actual sales volumes.

Another issue is that there seems to be no price data on residential sales.  The best data is assembled here, which in turn, is assembled from the Philippine Office of Colliers International, a global real estate agency.  These prices, in turn, are based on the average prices of a prime 3 bedroom condominium unit in the heart of the Makati Central Business District.  This is like basing nationwide US housing prices on the price of a prime 3 bedroom coop unit in Manhattan in New York, one of the priciest real estate markets in the US.  The data available in the Philippines is not representative of the true state of the entire national residential real estate market.  At best, it is an approximation of the Philippine Real Estate Market.  The BSP has stepped into the picture to overcome this deficiency by developing their own real estate index, which would be more comprehensive in scope. Here is a possible candidate for such an index.

But based on the data available, we arrived at this chart:


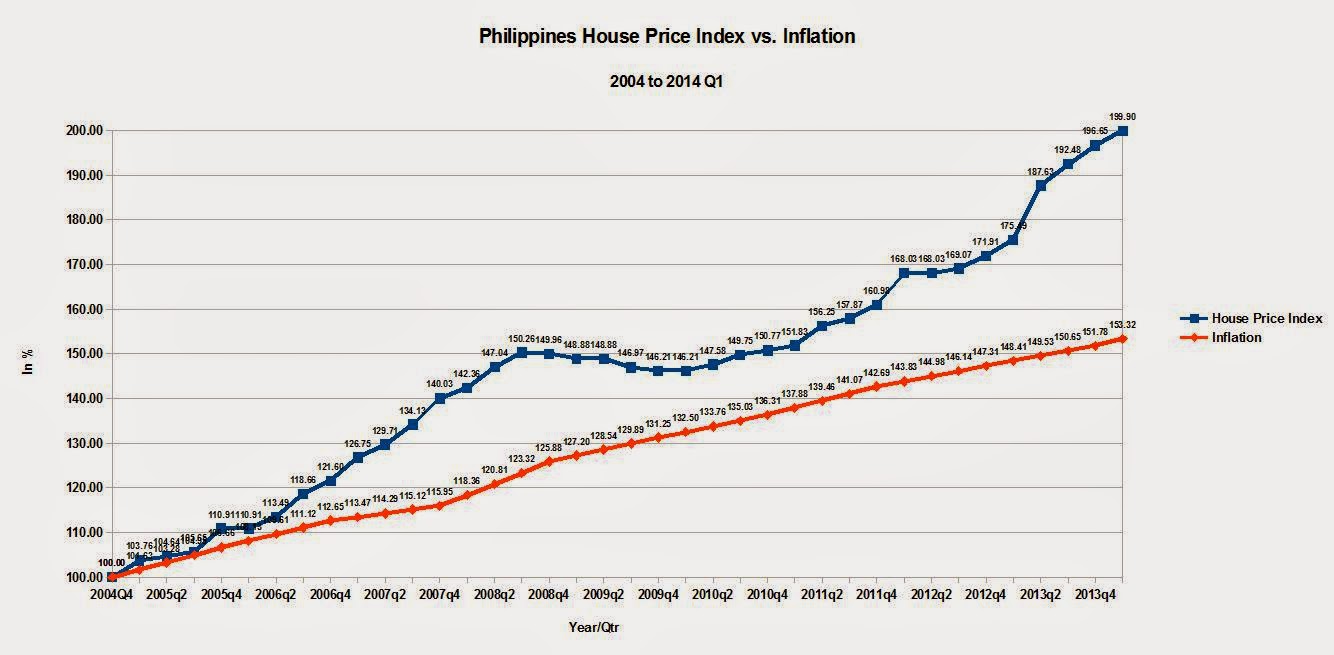
Based on this data, volumes (as indicated by Residential HLURB licenses to sell) may have already peaked in 2012, while prices have continued their upward climb to date.  Volume seems to have peaked at 264,237 units in 2012 and dropped 15% to 225,051 units in 2013.  In the first quarter of 2014, volumes declined further on an annualized basis, to just 189,668 units or 28% below peak volumes.

Prices though, have continued to climb since 2012, another 14% in 2013 and another 2% in the first quarter of 2014, representing a 16% increase over 2012 prices.

Is the same dynamic that played out in the US Residential Real Estate Market playing out in the Philippines?  It looks like it, but it may still be too early to tell.


Thursday, September 18, 2014

Is the Philippine Real Estate Bubble About to Burst?

In a previous blog post, we noted that Philippine House Prices have outpaced inflation by a wide margin.


Real Estate as a Store of Value:

In the Philippines, as is true in many other countries, real estate is often seen as a store of value, as a hedge against the relatively high inflation that characterizes so many emerging markets.  The investment options available and trustworthy to the general public tend to be few: government securities such as Treasury Bills, Bank Deposits, etc. As recently as 2012, less than 1% of the population own stocks because it is seen as too complex, or as investment vehicle only for the affluent, or a form of gambling. So to many Filipinos, the equity market is no place to be.

Negative Real Interest Rates

Unfortunately, the safest form of investing open to the general public, Philippine government securities, has been a money loser, inflation-wise, for the past several years.  Philippine Treasury Bill Yield Rates have continued their steady long-term decline to a point that they have barely hovered above zero in 2013.


Although yield rates have climbed in 2014, they do not compensate for the inflation underlying the economy.  As a result, real interest rates have been negative for almost four years running: from 2011 onwards.  Despite the recent rise in yields, real interest rates have dropped even further to a -2.68% as of July 2014.


The prolonged presence of negative real intest rates have increased the impetus to invest in real estate.  Construction as a percentage of GDP is the highest it has ever been since 1997 (the year the Asian Financial Crisis hit the Philippines).  Back in 1997, construction as a % of GDP was 11.14%.  As of the first semester of 2014, this ratio now stands at 11.20%, well above the historic average of 9.48%.


Construction Overhang

As a result, construction as a ratio of GDP has been well above this historic average of 9.48% since 2009.  The gains in construction spending have eaten away at the cumulative underhang or underinvestment in construction that has taken place since 2004, wherein the excessive spending that took place in the late 1990s was being absorbed.  As of now, in the first semester of 2014, the cumulative investment in construction of 0.4% is now at or slightly above equilibrium. But given the momentum of investment, construction investment is likely to surpass equilibrium in the coming years.


Real Estate Loans

The push into real estate is also reflected in Real Estate and Construction Loans.  Beginning sometime in 2010, Real Estate and Construction Loans as a % of Total Loan Portfolio broke out of its historic range of 12.5% to 17.0% from 1999 to 2010.  The percentage share of such loans peaked at 20.52% in September 2013 and has since dropped to just 18.65% as of June 2014.  Although the drop is significant, this ratio still has to drop even further to just reach the top end of its historic range.


Residential Real Estate and Commercial Real Estate Loans as a % of GDP have also begun to level off after climbing sharply since 2010.  Residential Real Estate Loans and Commercial Real Estate Loans now stand at 4.37% and 2.67% of GDP, respectively, as of March 2014.


As it stands, investment in construction and real estate have seem to reach equilibrium.  But the continued and prolonged presence of negative real interest rates will continue to drive investors to seek real estate as a store of value, a safe haven to protect their money against the vagaries of inflation.  The recent jump in Treasury Bill rates may dampen this enthusiasm for real estate but rates have to climb further for such market euphoria to disappear.

Friday, September 5, 2014

Charting the US Jobs Recovery - Washington State, DelMarVa + DC Edition - August 2014

Most media discussions on the US Jobs Recovery focus on just one number - the headline Unemployment Rate.  To add color to the first number, financial pundits like to add a second number - the Labor Force Participation Rate.  Both are intertwined and affect each other.  But in the aftermath of the Great Recession, there is a third, much more meaningful number that is almost never discussed - the Employment to Population Ratio.

Definitions

Now, what are these numbers?  Many people will give you a technical description that can be hard to grasp and make your eyes glaze over the minute you hear them.  But the reality is simple.

The Unemployment Rate is the percentage of:

PEOPLE WHO WANT  A JOB BUT DON'T HAVE ONE (Unemployed)/
LABOR FORCE

The Labor Force is:

PEOPLE WHO WANT AND HAVE JOBS (Employed) + PEOPLE WHO WANT A JOB BUT DON'T HAVE ONE AND ARE LOOKING FOR ONE (Unemployed)

The Labor Force Participation Rate is percentage of:

[PEOPLE WHO WANT AND HAVE JOBS (Employed) + PEOPLE WHO WANT A JOB BUT DON'T HAVE ONE AND ARE LOOKING FOR ONE (Unemployed)]/
WORKING AGE PEOPLE

Working Age People are generally defined as PEOPLE WHO ARE 16 YEARS AND OLDER.  In reality, they are:

[PEOPLE WHO WANT AND HAVE JOBS (Employed) + PEOPLE WHO WANT A JOB BUT DON'T HAVE ONE AND ARE LOOKING FOR ONE (Unemployed) + PEOPLE WHO ARE NOT IN THE LABOR FORCE (Not in Labor Force)]

The category PEOPLE WHO ARE NOT IN THE LABOR FORCE includes:


PEOPLE WHO ARE IN THE MILITARY
PEOPLE WHO ARE INSTITUTIONALIZED
PEOPLE WHO ARE STUDENTS
PEOPLE WHO ARE HOMEMAKERS
PEOPLE WHO ARE RETIRED
PEOPLE WHO ARE MARGINALLY ATTACHED TO LABOR FORCE (INCLUDING DISCOURAGED WORKERS)


The Employment to Population Ratio is the percentage of:

PEOPLE WHO WANT AND HAVE JOBS/
WORKING AGE PEOPLE

In other words, PEOPLE WHO WANT AND HAVE JOBS/
[PEOPLE WHO WANT AND HAVE JOBS + PEOPLE WHO WANT A JOB BUT DON'T HAVE ONE AND ARE LOOKING FOR ONE + PEOPLE WHO ARE NOT IN THE LABOR FORCE


How does this work out?

According to this chart from the popular financial blog, Calculated Risk, the US, in May 2014, gained back all the jobs lost since the Great Recession started in November 2007.


But this is deceptive.  For one, the working age population of the US grew by 16.362 million people or 7.06% from 2007 to August 2014, while the labor force grew by 2.835 million people or only 1.85% during the same period.   The number of employed persons grew by only 321,000 people and unemployed people grew by 2.513 million people or 35.50% during the same period. People Not in the Labor Force grew by 13.526 million or 17.18% during the same period. In fact, People Not in the Labor Force is at an absolute all time high of 92.269 million.

United States
Employment Situation
In Thousand Persons


2007 to August 2014

2007 2008 2009 2010 2011 2012 2013 August 2014 Variance % Variance
Civilian Non Institutional Population 231,867 233,788 235,801 237,830 239,618 243,284 245,679 248,229 16,362 7.06%
Labor Force 153,124 154,287 154,142 153,889 153,617 154,975 155,389 155,959 2,835 1.85%
Employed 146,047 145,362 139,877 139,064 139,869 142,469 143,929 146,368 321 0.22%
Unemployed 7,078 8,924 14,265 14,825 13,747 12,506 11,460 9,591 2,513 35.50%
Not in Labor Force 78,743 79,501 81,659 83,941 86,001 88,310 90,290 92,269 13,526 17.18%

Source: bls.gov


For the United States, the headline Unemployment Rate has dropped down significantly, from a peak of 9.9% in 2009 to just 6.1% as of August 2014.  The Labor Force Participation Rate continues to drop and is now at 62.8% - levels not seen since the late 1970's when women started entering the workforce in droves.  The Employment to Population Ratio has only recovered marginally from its recessionary low of 58.3% to just 59% in August 2014.  It is nowhere near its pre-recession average.  In other words, job growth has been growing only barely faster than the growth in the working age population.


Economists have attributed to this phenomenon to increased retirements among the elderly.  But the Bureau of Labor and Statistics itself  is projecting large increases in the Labor Force Participation Rate among people aged 65 and older. The reality is fewer people can afford to retire.


Washington State


Although Washington State's Unemployment Rate has dropped considerably from a peak of 9.9% in 2010 to just 5.6% as of July 2014, its Labor Force Participation rate has continued to drop to a new low of 63.1% - a level not seen since 1977 when women entered the labor force in considerable numbers.  The Employment to Population Ratio now stands at 59.5% or just 0.4% above its recessionary low as of 2013.


Regional Comparison

So how does the DELMARVA + DC Region stack up to the rest of the United States?

Delaware

The state of Delaware is in a funk, employment-wise.  Its Labor Force Participation Rate, at 61.2% as of July 2014, is even lower than the 62.7% Labor Force Participation Rate the state registered in 1976, the earliest available BLS.Gov data.  Although its Unemployment Rate has dropped from a peak of 8.0% in 2010, to just 6.2% as of July 2014, its Employment to Population Ratio, at 57.4% as of July 2014, is still hovering near the bottom at 56.7% in 2013.


Maryland

Like Delaware, Maryland's Labor Force Participation Rate continues to trend lower, hitting 66.4% as of July 2014 - levels not seen since 1977.  Its Employment to Population Ratio has yet to bottom out. At 62.3% as of July 2014, it is reaching levels not seen since the early 1977.  Its Unemployment Rate, however, has dropped sharply, from a peak of 7.9% as of 2010 to just 6.1% as of July 2014.  As the previous data indicates, much of the drop has come from people dropping out of the labor force altogether.


Virginia

Virginia has seen an uptick in its labor force participation rate, from a post-recessionary bottom of 66.4% in 2013, to 66.7% as of July 2014.  Likewise, its Employment to Population Ratio has improved to 63.2% as of July 2014., slightly higher than its post-recessionary bottom of 62.6% in 2010. Unemployment Rate has dropped from its 2010 peak of 7.1% to just 5.4% as of July 2014.


District of Columbia

The District of Columbia's Labor Force Participation bottomed out at 67.8% in 2011, bounced up to the 69.3% level for 2012 and 2013 and is down again to 68.1% as of July 2014.  Its Employment to Population Ratio bounded up sharply from a low of 60.9% as of 2011 to 63.5% as of 2013 and now stands at 63.1% as of July 2014.  Its Unemployment Rate, which reached a peak of 10.2% as of 2011, now stands at 7.4% as of July 2014.