Search This Blog

Friday, June 10, 2016

How low can Hong Kong Property Prices Go? Some Clues from the Not Too Distant Past.

Last January 8, 2016, in a post titled "Singapore, Malaysia, and Thailand Post Flat to Declining Housing Prices, Can the Philippines and Indonesia be Not Far Behind? - 2nd Qtr 2015", we showed the remarkable run-up in housing prices in Asia, often outpacing inflation by a wide margin.  One of the countries featured was Hong Kong, whose real estate prices have jumped by 234.46% in a little over ten years, outpacing inflation by a staggering 207.16% as of the second quarter of 2015.


Little did we know that property prices peaked a quarter later, in the third quarter of 2015.  Since then, Hong Kong property prices have entered a correction phase, dropping by 10.12% in the two quarters since then.


When we go back to charts with historical data dating back to 1980, we find that such corrections can sometimes presage a bear market in properties. The last major bear market started in October 1997, several months after Hong Kong was handed over back to China from the U.K., lasting an arduously long 69 months or almost six years.  During this phase, prices dropped a gut-wrenching 66.22% in all classes, dipping below their inflation-adjusted levels for two quarters in 2003.  The bear market took place during the financial contagion that occurred during the Asian Financial Crisis.


Unsurprisingly, the last correction took place amid the Global Financial Crisis of 2008.  The correction was short, lasting a mere seven months, from June 2008 to December 2008. Property prices for all classes dropped 17.22% - or almost a bear market (20% decline).

Hong Kong Property Price Indices are broken down by property class.  Property classes are defined by the property's area.
  • Property Class "A": Area below 40 sq. m.
  • Property Class "B": Area between 40 sq. m. and 69.9 sq. m.
  • Property Class "C": Area between 70 sq. m. and 99.99 sq. m.
  • Property Class "D": Area between 100 sq. m. and 159.9 sq. m.
  • Property Class "E": Area above 160 sq. m.

Here's an annual chart of the various Hong Kong Property Price Indices by property class:


Here's the same chart on a monthly basis:


    As evidenced by the chart below, the largest price run-up and decline in the last decade have taken place in the smaller property classes - the A,B, and C Property Classes.  Class A properties have risen the most, rising by a staggering 225.19%.  In the three bull markets prior to that, it was the largest property class, Class E - with areas above 160 sq. m., that have risen the most.  The smaller property classes lagged behind,


    A similar dynamic has taken place in the recent market decline.  It was the Class A properties that declined the most, followed by the bigger property classes. With the exception of the period from October 1997 to July 2003, the smaller property classes were more stable.


    This is born out by the historical price volatility of each property class, as demonstrated by the chart below: 


    The recent large price swings for the smaller property classes have been outside recent historical norms.  


    As seen in the chart above, there were quite a few times when the annual change in the property price indices was more than two standard deviations beyond the mean, the most recent being in 2010 when the A Class posted an annual gain of 26.77%. Under a normal probability distribution, this does not happen 95% of the time.

    These smaller properties are generally held by small retail investors who tend to purchase properties for their own use.  As a result, volatility is usually lower among the smaller property classes. The large run-up and decline in these smaller property classes in recent times indicates that the buying was driven by rampant speculation rather than real consumption.  And that always ends badly.

    So, how low can Hong Kong property price indices go? Your guess is as good as ours.  But given the spectacular price increases from December 2008 to September 2015, it wouldn't be beyond us to think that the prices could revert back to their inflation adjusted levels as they did in the aftermath of the Asian Financial Crisis (October 1997 to September 2003), declining by more than 60% across all property classes.


    Tuesday, May 24, 2016

    The Philippine Real Estate Bubble Has Also Burst For... Ayala Land!

    It seems like that the real estate bubble has also burst for one of the biggest and most prestigious real estate developers in the country: Ayala Land or ALI for short.

    Although Installment Contract Receivables (ICRs) in absolute terms looks fine and dandy, there is a very discernable quadrupling of its Past Due but Not Impaired Installment Contract Receivables in 2015.


    A closer look shows that a big jump in past due ICRs took place in the past due ICRs that are less than 30 days old and over 120 days old.


    The jump in past due ICRs becomes clearer when viewed in relative terms.


    So past due ICRs and Impaired ICRs now comprise a striking 13.4% of the entire ICR portfolio.


    If all the past due ICRs go bad, it will take away a nice chunk (5.88%) of ALI's Stockholder's Equity.


     Although Past Due ICRs have been rapidly going up, Impaired ICRs have remained static at Php 9.55 million and have represented a declining share of Total ICRs.  As the Past Due ICRs age further and become even more unrecoverable, Impaired ICRs have only one place to go: up!


    Source: Ayala Land 2015 Annual Report

    Friday, May 6, 2016

    One Major Reason for the Rise of the Vulgarian Rodrigo Duterte: Wealth Inequality

    Let's face it.  The Philippines always has been and it seems like it will always be a plutonomy wherein a huge chunk of the economy is controlled by a very wealthy elite.  Most of the time, the masses were placated by trickle down economics, wherein the great unwashed could feed off the crumbs left by their masters at the dinner table.  As the wealthy grew wealthier, the crumbs seemed to get better.  And, very often, that was enough for the poor.

    Not this time.

    The people have had enough of crumbs.  They want a greater share of the wealth of the country and are increasingly vocal about it.  They have that found their voice in one man, an outsider, who by circumstances of his birth, rough speech, and mannerisms, is an outsider to national politics, even though he has been a long-time Mayor of Davao, the Philippines third largest city.  That man is Rodrigo Roa Duterte.  He has captured the imagination of the poor and lower middle classes with very little money and very little by way of political machinery.  Mar Roxas, the establishment candidate and grandson of a former president, remains a laggard in the polls despite all the inherent advantages of being the anointed one.  The sudden political ascendancy of Duterte has whipped the upper classes as well as the Roman Catholic Church into a state of frenzy.  Why?  Although they castigate him for his loose morals, politically incorrect jokes, and vigilante approach to justice, the real reason is that Duterte seems to be a man they cannot control the usual means, meaning money and power but mostly money.  The previous populist, Erap, was a man who loved fine wines and lots of women and lived accordingly and that was his downfall.  Duterte does not seem the same way.

    Yet why are the people acting this way?  Hasn't the heady economic growth of the past two administrations satisfied the masses?


    The answer, of course, is no.

    The wealth has not trickled down as fast as the people would have wanted and the gap in wealth and income inequality has only increased.

    The facts do bear this out.  TFhe Credit Suisse 2015 Global Wealth Report places the total wealth of the country at US$111 billion dollars as of 2015.  And Swiss bankers, who primarily serve Ultra High Net Worth Clients (UHNW Clients = Wealth > US$ 10 million), do make it their business to know how much wealth there is in each country they want to do business in.  Of this, the top decile or the top 10% have captured 76% of it.  What about the top 1%, the economic class that sparked the Occupy movement in the USA? They hold 51% of the total wealth in the country.  In 2010, when PNoy was elected, that figure stood at 43% for the top percentile.  That's an almost 20% increase during the PNoy administration alone.


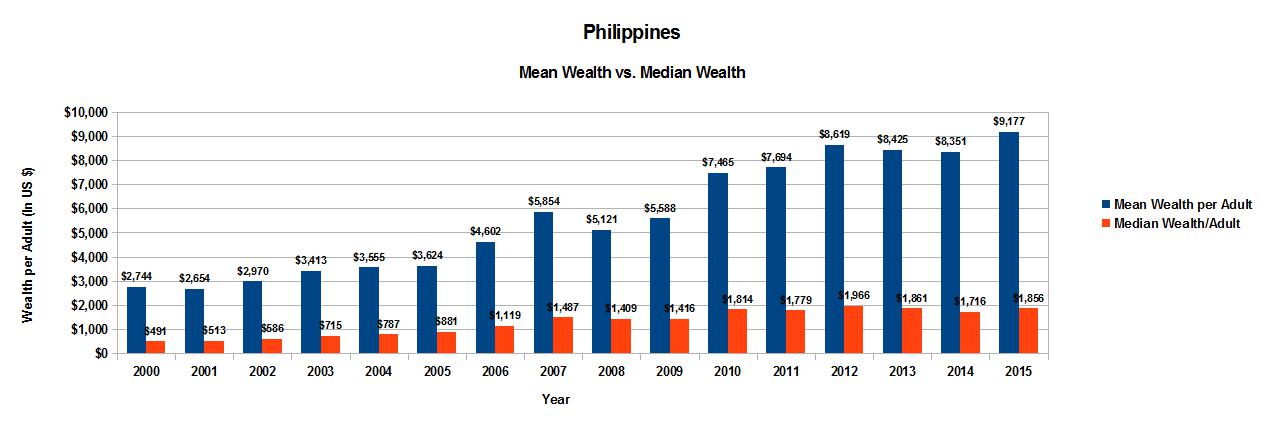
    Meanwhile, the median wealth - the point at which half the population are either below or above it, has barely budged during the same time period.


    As of 2015, median wealth stood at US $1,856, just a little over 10% above where it was in 2010: US$1,814.  Eighty-eight percent of Philippine adults have wealth under US$10K.  The top decile is estimated to have wealth ranging from over US$10K.  The top 1%? They hold wealth over US $100K.  And the top 0.10% hold wealth greater than US $1 million.


    But even the very top, the creme de la creme of the Philippine economic elite - defined as having wealth greater than US$1 million - is still very unequal.  Around 84% hold wealth between US$1 million to US$5 million.  Just 9% hold wealth between US$5 million to US$10 million.  And only 7% have wealth greater than US$10 million.  In other words, only 2,503 adults in the entire country merit the services of a Credit Suisse private banker.


    Now that is a recipe for a pitchfork revolution.

    Friday, April 29, 2016

    Great Depression vs. Great Recession GDP Growth Rates - Updated As of First Quarter 2016

    In March 2015, two illustrious economists, both Former Fed Chairman Ben Bernanke and Former Treasury Secretary Larry Summers have been duking it out on the blogosphere about secular stagnation.  In layman's terms, both are attempting to describe why does the US Recovery from the Great Recession feel so sluggish.


    Although the overall collapse in REAL GDP was relatively shallow  (-3.1% from peak to trough in real terms and -0.4% in nominal terms) and took place over two years (2008 to 2009), the recovery in the five years since then has been very anemic.  The economy reached parity with its pre-recession peak GDP in nominal terms in 2010, only three years after the Great Recession started in December 2007.   In real terms, it took an additional year, by 2011, to reach parity with its pre-recession peak.  By the 1st Qtr of 2016, the US economy is only 26.37% larger, in nominal terms, than the bottom in 2009, averaging only 3.40% growth every year since the Great Recession bottomed out. In real terms, the US economy is only 16.52% larger than the bottom in 2009, averaging only 2.21% growth every year since 2009.


    The overall economic contraction during the Great Depression was much more severe (-46% in nominal terms and -27% in real terms from peak to trough) and took much longer (four years from 1930 to 1933).  In real terms, economic parity with its pre-depression peak was only reached in 1936, seven years after the start of the Great Depression. Despite the severity and depth of the economic contraction, it only took three years after the 1933 bottom for the US economy to reach parity (in real terms) with pre-depression peak in 1929.  Recovery, in terms of economic growth rates, was a lot more robust, averaging 10.9% annually during this period.  In the four years since the US economy bottomed out in 1933, the US economy was 43.5% larger than the bottom in 1933, averaging 9.44% growth per year every year. In nominal terms, the US economy only recovered its pre-depression peak only sometime in 1941, when WWII spending began in earnest.


    Great Depression vs. Great Recession


    Source: www.worldbank.org, www.bea.gov, Reinhart and Rogoff, "This Time is Different"

    Friday, April 22, 2016

    The Philippine Real Estate Bubble Has Also Burst for Vista Land

    Last year, we documented how the Philippine Real Estate Bubble had already burst for HOUSE (8990 Holdings, Inc.) wherein there was a marked deterioration in 2014 in delinquencies in the company's installment contract receivables (ICRs) for the year 2014.

    A simple chart tells the story:

     
    Simply put, 8990's ICRs that were over ninety days past due jumped by a minimum factor of 10 times in the year 2014. Around 10% of HOUSE's ICRs became impaired.


    In a subsequent post on a related blog, we noted that a similar dynamic was playing out in Vista Land & Lifescapes, Inc. (VLL), one of HOUSE's main rivals in the mass housing market space. Although not quite as acute as HOUSE, VLL exhibited a significant deterioration in the credit quality of its ICRs.


    The deterioration has continued throughout the whole of 2015,  confirming that real estate bubble has also burst for VLL.  In 2015, there was a marked jump in VLL's ICRs that were over 90 days past due.  


    Unlike HOUSE, the value of the impairments relative to the entire ICR portfolio is very small - less than 1% for VLL versus 10% for HOUSE.


    Source: Vista Land & Lifescapes, Inc.

    Friday, April 15, 2016

    Great Depression vs. Great Recession: Unemployment - Updated March 2016

    The reported unemployment rate during the Great Depression was significantly higher than the reported unemployment rates of the Great Recession.


    But are the two rates comparable? Before 1938, children were a significant part of the labor force.  In 1900, children younger than sixteen made up as much as eighteen percent of the labor force.  It was only when the Fair Labor Standards Act of 1938 became law that children younger than sixteen were barred from working in manufacturing and mining but not agriculture.

    To make the numbers more comparable, it is better to get the ratio of Employment to the Total Population (which includes children). When we do this, the two measures are not so far apart.  In 1929, the year "0" for the Great Depression, 54.41% of the total population was employed.  By 1933, year "4", only 41.97% of the population was employed. But the rise in employment was dramatic.  Four years later, 47.63% of the population was employed, almost six percentage points higher. The employment momentum only stalled when the tax hikes of 1937 induced another recession in 1938 and new child labor laws barred children from the labor force.  If the momentum had continued, the employment ratio would have recovered in less than five years.


    In 2007, the year "0" of the Great Recession, 48.38% of the population was employed.   Four years later, only 44.82% of the population was employed, a drop of less than 4 percentage points.  By March 2016 or four years after the Great Recession bottomed out, only 46.70% of the population is employed, an increase of only 2.01% percentage points.  The growth rate of employment was less than a third that of the Great Depression.  At this rate, it will take four more years or 2020 before employment recovers to that of Year "0".


    Great Depression vs. Great Recession


    Sources: www.worldbank.org, www.bea.gov, www.bls.gov,  Reinhart and Rogoff, "This Time is Different"

    Monday, April 11, 2016

    The Mysterious Decline of Filipino Students in the US

    There is a noticeable decline in the number of Filipino students in US Colleges and Universities, based on data from the Open Doors Report. The number of Filipino students in US tertiary education peaked at 4,225 students in 2008 and is now at 3,026 students as of 2014-2015 school year.  This number is even lower than that of the year 2000, when 3,139 Filipino students were participating in US higher education.


    Source: Open Doors Report, 2015

    It is not clear why this is happening.  This decline has come at a time when the country has experienced very solid economic growth that is one of the best in Asia, under the leadership of both Presidents Gloria Macapagal-Arroyo and Benigno Aquino III


    The decline has also come about at a time when almost every ASEAN neighbor, with the exception of Thailand (which has been mired in political uncertainty), has been increasing the number of students it sends the US universities.


    In absolute numbers, the Philippines ranks below Singapore, which has a population that is around 1/20th the size of the Philippines but above low-income or low population countries such as Brunei, Cambodia, Laos, and Myanmar. Vietnam, which is almost as big as the Philippines in terms of population, sends more than six times as many students to the US. 

    In terms of percentage of tertiary students, the Philippines ranks second to the last in the ASEAN, above low-income Laos.  At 0.15% of its tertiary education student population, even the former hermit country Myanmar, ranks higher than the Philippines (which had 0.11% as of 2012).  Naturally, rich Singapore sends roughly 5% of its tertiary education students to study in the US higher education system.


    Source: www.worldbank.org, 2015 Open Doors Report

    Are Filipino Universities getting better? It is not clear that they are getting better.  From this infographic from CNN Philippines, the ranking of the top four universities in the Philippines have declined in recent years.


    Could the decline be due to the increasing unaffordability of a college education in the US?  Since 1995, out-of state tuition and fees have climbed a staggering 226 percent for public universities. 


    Based on data from the College Board, the annual undergraduate student budget now averages US $38,541 for a public four-year out-of-state on campus education as 2015.  For a private nonprofit four-year on campus education, it's even worse: US $47,831.


    As a result, college has become unaffordable for many, including American workers.  These figures represent 126% and 160% of US worker median compensation of $30K as of 2014.  Most US students pay an average net price that is substantially lower than published college prices, as much as 28% lower.  The discount is primarily due to financial aid and grants available to US students.


    Most of the time, foreign students don't qualify for financial aid and, in fact, subsidize low-income American students by paying full freight for their education. This education can cost around US $160K to $200K for a four-year college education.

    So, by definition, foreign students come from relatively well-off families in their home countries in order to study abroad.  According to the 2015 Credit Suisse Global Wealth Report, around 530K Filipino adults had wealth greater than US $100K.  Of this, around 471K Filipino adults had wealth between US $100K to US $1M, and around 59K Filipino adults had wealth greater than US $1M.  


    So as of 2015, Filipino students in the USA amounted to 0.55% of wealthy adults in the Philippines.  This ratio is similar to that of Indonesia and Laos, both at 0.55%. The outlier here is Vietnam, where the Vietnamese foreign student population in the USA amounts to a staggering 29.42% of the wealthy adult population in Vietnam.


    Given all this information, it is still not clear why the absolute number of Filipino students in US Colleges and Universities is declining.  This phenomenon remains a mystery.