Search This Blog

Showing posts with label GDP. Show all posts

Friday, October 28, 2016

Great Depression vs. Great Recession GDP Growth Rates - Updated As of the Third Quarter 2016

In March 2015, two illustrious economists, both Former Fed Chairman Ben Bernanke and Former Treasury Secretary Larry Summers have been duking it out on the blogosphere about secular stagnation.  In layman's terms, both are attempting to describe why does the US Recovery from the Great Recession feel so sluggish.


Although the overall collapse in REAL GDP was relatively shallow  (-3.1% from peak to trough in real terms and -0.4% in nominal terms) and took place over two years (2008 to 2009), the recovery in the seven years since then has been very anemic.  The economy reached parity with its pre-recession peak GDP in nominal terms in 2010, only three years after the Great Recession started in December 2007.   In real terms, it took an additional year, by 2011, to reach parity with its pre-recession peak.  By the 3rd Qtr of 2016, the US economy is only 29.35% larger, in nominal terms, than the bottom in 2009, averaging only 3.75% growth every year since the Great Recession bottomed out. In real terms, the US economy is only 15.95% larger than the bottom in 2009, averaging only 2.14% growth every year since 2009.


The overall economic contraction during the Great Depression was much more severe (-46% in nominal terms and -27% in real terms from peak to trough) and took much longer (four years from 1930 to 1933).  In real terms, economic parity with its pre-depression peak was only reached in 1936, seven years after the start of the Great Depression. Despite the severity and depth of the economic contraction, it only took three years after the 1933 bottom for the US economy to reach parity (in real terms) with pre-depression peak in 1929.  Recovery, in terms of economic growth rates, was a lot more robust, averaging 10.9% annually during this period.  In the four years since the US economy bottomed out in 1933, the US economy was 43.5% larger than the bottom in 1933, averaging 9.44% growth per year every year. In nominal terms, the US economy only recovered its pre-depression peak only sometime in 1941, when WWII spending began in earnest.


Source: www.worldbank.org, www.bea.gov, Reinhart and Rogoff, "This Time is Different"

Monday, November 3, 2014

Great Depression vs. Great Recession

Why does the US Recovery from the Great Recession feel so sluggish?  That's because it is!

Although the overall collapse in REAL GDP was relatively shallow  (-3.1% from peak to trough) and took place over two years (2008 to 2009), the recovery in the five years since then has been very anemic.  The economy reached parity with its pre-recession peak in 2011, only four years after the Great Recession started in December 2007.   In 2014, the US economy is only 10.9% larger than the bottom in 2009, averaging only 2.1% growth every year since the Great Recession bottomed out.

The overall economic contraction during the Great Depression was much more severe (-26.7% from peak to trough) and took much longer (four years from 1930 to 1933).  Economic parity with its pre-depression peak was only reached in 1936, seven years after the start of the Great Depression. Despite the severity and depth of the economic contraction, it only took three years for the US economy to reach parity with pre-depression peak in 1929.  Recovery, in terms of economic growth rates, was a lot more robust, averaging 10.9% annually during this period.  In the five years since the US economy bottomed out in 1933, the US economy was 38.6% larger than the bottom in 1933, averaging 6.7% growth per year every year. In nominal terms, the US economy only recovered its pre-depression peak only sometime in 1941, when WWII spending began in earnest.


Source: www.worldbank.org, www.bea.gov, Reinhart and Rogoff, "This Time is Different"


Why was the recovery during the Great Depression a lot more robust than the Great Recession?  That is the subject of future blog posts.

Sunday, July 20, 2014

A Stealing Analysis of the Marcos Regime

Marcos is often listed as one of the world's most corrupt leaders.  In fact, based on this list, which was ultimately sourced from Transparency International's Global Corruption Report, the Philippines has the dubious distinction of having two Philippine Presidents in the top ten most corrupt leaders: #2 Marcos and #10 Erap.


Plunder (In US$ Billions)
Leader Country In Office Low High
Suharto Indonesia 1967 to 1998 $15.000 $35.000
Marcos Philippines 1965 to 1986 $5.000 $10.000
Mobutu Sese Seko Zaire 1965 to 1997 $5.000
Sani Abacha Nigeria 1993 to 1998 $2.000 $5.000
Slobodan Milosevic Serbia/Yugoslavia 1989 to 2000 $1.000
Alberto Fujimori Peru 1990 to 2000 $0.600
Jean-Claude Duvalier Haiti 1971 to 1986 $0.300 $0.800
Pavlo Lazarenko Ukraine 1996 to 1997 $0.114 $0.200
Arnoldo Aleman Nicaragua 1997 to 2002 $0.100
Joseph Estrada Philippines 1998 to 2001 $0.078 $0.080

Some of this wealth was acquired in a few short years.  Some of it was acquired over decades.  Some of it was stolen from relatively small economies.

Given all these factors, which leader stole the most as a percentage share of their respective economies?


The answers might surprise you.  For instance, Suharto of Indonesia, who is estimated to have plundered as much as US$35 billion, is fourth on this list, stealing just 0.56% to 1.32% of his nation's economy.  Mobutu Sese Seko of Zaire (now the Democratic Republic of Congo), who stole US$ 5 billion over 32 years, stole the most from his country's economy: an astounding 10.49%, more than three times the second most corrupt leader: Sani Abacha of Nigeria, who stole as much as 3.35% of his nation's GDP.

And Marcos?  Marcos, who ranked number two in terms of absolute amount plundered, was demoted to number three, stealing anywhere from 1.20% to 2.39% of the Philippine economy during his time as President.  Our beloved Erap still ranks as #10, stealing 0.03% of the Philippine economy from mid 1998 to early 2001.

Marcos Plunder as a Share of the Philippine Economy

From the time Marcos became President of the Philippines on December 30, 1965 till the time he fled the country on February 25, 1986, the Philippine economy had a cumulative nominal GDP of US$ 418.311 billion.

If Marcos stole US$ 5 billion, then Marcos stole 1.20% from the country's total output.


If Marcos stole US$ 10 billion, then Marcos stole roughly 2.4% from everything that was produced by the Philippine economy during his years in office.


There are also strong indications that Marcos did much of his stealing after the declaration of Martial Law because, as everyone knows, "absolute power corrupts absolutely."

If this is so, then Marcos stole a bigger share from a slightly smaller pie: US$ 361.530 billion in cumulative GDP from 1973 to 1985.

If he stole US$ 5 billion, then Marcos stole 1.38% of the nation's economy after 1972.


If he stole $10 billion, then he stole as much as 2.77% of the entire Philippine economy during the 13 to 14 years after the declaration of Martial Law.


Marcos Plunder as a Share of Philippine Government Spending

During the Marcos years, the Philippine government racked up at least US$ 40.648 billion in general government consumption expenditures.  In other words, it spent at least US$ 40.648 billion from 1966 to 1985.

If Marcos plundered US$ 5 billion, then this represents 12.30% of all government consumption expenditures during this period.


If Marcos plundered US$10 billion, then he stole almost 25% of total Philippine government spending.


If much of the stealing was done after the declaration of Martial Law, then if he stole US$ 5 billion, he stole 14.39% of all Philippine government consumption expenditures of US$ 34.736 billion.


If he stole US$ 10 billion, then he stole almost a gargantuan 29% of Philippine government spending!


So Marcos' well-deserved reputation as Mr. Ten Percent should really be Mr. Thirty Percent!


How much would Marcos be stealing if he were in power today?

When Marcos left in 1986, the Philippines was a US$ 33.09 billion economy.  As of 2013, the Philippines is so much bigger - a US$ 272.07 billion economy.  In 1986, Philippine government consumption expenditures amounted to just US$ 2.88 billion.  Today, it amounts to US$ 30.37 billion.


In 1986, Nominal GDP per capita in the Philippines was US$ 535.  Today, it's multiples of that: US$ 2,765.


So if Marcos were alive today or if his family were in power today, the Marcoses would be stealing anywhere from 1.20% to 2.77% of the Philippine economy or 12.30% to 28.79% of total Philippine government spending.

If Marcos were to continue stealing from the Philippine economy on the same rapacious scale during his regime, he would be stealing anywhere from a low of US$ 3.3 billion to as high as US $7.5 billion from the Filipino people every year!

If the Marcoses were to incorporate, their annual plunder would easily put them in the top six Philippine corporations in terms of 2013 revenues.  At the high end of US$ 7.5 billion, the Marcoses would rank a distant third to San Miguel Corporation's Top Frontier Investment Holdings (with revenues of US$ 16.7 billion) and ahead of Meralco (with revenues of US$ 7.0 billion).  At the low end of US$ 3.3 billion, they would rank below PLDT (with revenues of US$ 4.0 billion) and slightly above Ayala Corporation (with revenues of US$ 3.2 billion).


In 2013, the Philippine government had general government consumption expenditures of Php 1.282 trillion or US$ 30.368 billion.  In other words, government spending amounted to 11.16% of the entire Philippine economy.  Government spending's share of the economy has climbed significantly since Marcos fled the Philippines in 1986.  During the Marcos years, government spending comprised 9.72% of the economy.  In the post Marcos years (1986 to 2013), government spending has averaged 10.46%.

If Marcos plunders the government treasury at the same rapacious scale during his regime,  his "take" from government spending would be significantly higher than his "take" from plundering the Philippine economy, simply because government spending occupies a larger proportion of the economy now than during his time.

In Peso terms, their annual plunder would amount to Php 157.74 billion (US$ 3.74 billion) to Php 369.21 billion (US $ 8.74 billion).  In contrast, total annual expenditures from the scandalous Disbursement Acceleration Program (DAP) amounts to only Php 136.75 billion.  The equally scandalous Priority Development Assistance Program (PDAF) amounts to only Php 10.21 billion.  The amounts for DAP and PDAF assume that everything from these current government programs are stolen, which does not seem to be the case, so the actual amount plundered through these programs could be much lower.


How much would the Marcoses be stealing from every Filipino today?  Anywhere from Php 1,403.51 (US$ 33.24) to Php 3,239.78  (US$ 76.72) for every Filipino man, woman, and child every year.  DAP annual disbursements only amount to Php 1,389.83 (US$ 32.91) per person per year.  PDAF annual disbursements are much, much lower than that: only Php 103.76 (US$ 2.46) per person per year.


Data Sources: www.worldbank.org, www.bsp.gov.ph


Monday, June 9, 2014

Philippine Government Budget Deficit as a % of GDP

The credit rating of the Philippine Government was recently upgraded one level up investment grade (from BBB- to BBB) by Standard & Poors last May 8, 2014.  Aside from solid economic growth of 7.2% in 2013, government finances have been on a steady uptrend.  The government deficit, at -1.42% of GDP, is less than half of the -3.49% level when President Aquino assumed power in 2010.


Source: NSCB.GOV.PH, BSP.GOV.PH

Monday, March 3, 2014

The Pinoy Rate of Growth

The Indian economy has long been famous for the "Hindu Rate of Growth", which was characterized by a growth in GDP per capita of only one percent per annum - a rate of growth so slow that it was imperceptible to the general population.  This growth was attributed to the "Licence Raj", the Government of India's protectionist and interventionist policies.  The dismantling of the "Licence Raj" in 1991 with economic liberalization and reform has led to a considerable speeding up of per capita GDP growth.  Growth in GDP per capita (in constant 2005 US $) for India has now averaged 3.08% per year for the last 52 years (from 1960 t0 2012), more than double the 1.49% annual average growth rate for the Philippines during the same period.

Pinoy Rate of Growth

Do we have our very own Pinoy Rate of Growth, wherein economic improvement has been so slow as to be imperceptible? Around 10% of our population would shout a resounding "Yes!" and have voted with their feet, moving to other countries to find work and, perhaps, happiness.

Despite the acceleration of growth of the Philippine economy, growth in GDP per capita (in constant 2005 US $) has averaged only 2.90% per annum for the last five years (2008 to 2012), forty percent lower than India's 5.09% average annual growth rate for the same period. 


Although India is a large nation with a large economy, it has over a seventh of the world's population.  As a result, its GDP is spread out over a billion people.  This results in a per capita GDP that is much lower than the Philippines.  So even if India is growing much faster on a GDP per capita basis, it will take decades for India to catch up to the Philippines.

India's per capita GDP (in constant 2005 US $) now stands at $1,086 as of 2012.


The Philippines' per capita GDP (in constant 2005 US $) is $1,430 as of 2012, almost a third larger than India's.


Improved economic performance of the Philippines, in terms of GDP per capita, has been a relatively recent development.  Significant strides in the GDP per capita growth rate only came about with the last two Presidents.


As a result, many other nations have overtaken us in the past and many other nations probably will overtake us in the future.

President Diosdado Macapagal

President Macapagal's economic record, in terms of growth in GDP per capita (in constant 2005 US $), dwarfs that of the last four Philippine Presidents who succeeded him.  Despite this, six other nations that had a lower GDP per capita (in current US $) when he took office, eclipsed him within one year (1962).

  1. Algeria
  2. Brazil
  3. Dominican Republic
  4. Ecuador
  5. St. Kitts and Nevis
  6. Tunisia


A significant devaluation of the Philippine Peso versus the US Dollar, from Php 2.02/USD in 1962 to Php 3.73/USD  didn't help either.


When adjusted for inflation, no other nation overtook the Philippines in terms of GDP per capita (in constant 2005 US $) during his term.


President Ferdinand Marcos

Marcos loyalists like to point out that President Marcos economic performance was strong.  But the truth of the matter was that our nation's decline accelerated under his regime.

In terms of nominal GDP per capita (current US $), at least seven other nations, including our ASEAN neighbor Thailand, overtook us during his 21 years of power:
  1. Swaziland (1969)
  2. Morocco (1970)
  3. Paraguay (1970)
  4. South Korea (1970)
  5. Botswana (1972)
  6. Tonga (1975)
  7. Thailand (1983)


In constant 2005 US $, at least three other nations overtook the Philippines in GDP per capita: 

  1. Botswana (1975)
  2. Paraguay (1978)
  3. Thailand (1984)


President Corazon Aquino

Cory Aquino fared a little better than Marcos: no other nation surpassed the Philippines in terms of GDP per capita, both in current US $ or constant 2005 US $, during her term.


But Tita Cory ranks the lowest in terms of GDP per capita growth (in constant 2005 US $) among all the Philippine Presidents since 1961: a lowly 0.72% Compounded Annual Growth Rate (CAGR) during her term, lower even than her predecessor and nemesis, President Marcos (0.86% CAGR).

President Fidel Ramos

Despite undertaking a massive liberalization of the Philippine economy, particularly in the banking, power, and retail sectors, President Ramos' economic performance (1.28% in terms of constant 2005 GDP per capita CAGR) was better than that of Marcos (0.86% CAGR) and Cory (0.72% CAGR), but lower than that of  Macapagal (1.78% CAGR).

During his tenure, two other nations overtook the Philippines in terms of nominal GDP per capita:

  1. Samoa (1994)
  2. Egypt (1997)


In terms of constant 2005 US $ GDP per capita, it was even worse: four other nations overtook the Philippines, including Indonesia, another ASEAN country:

  1. Indonesia (1993)
  2. Cabo Verde (1994)
  3. Bosnia and Herzegovina (1996)
  4. Egypt (1998)


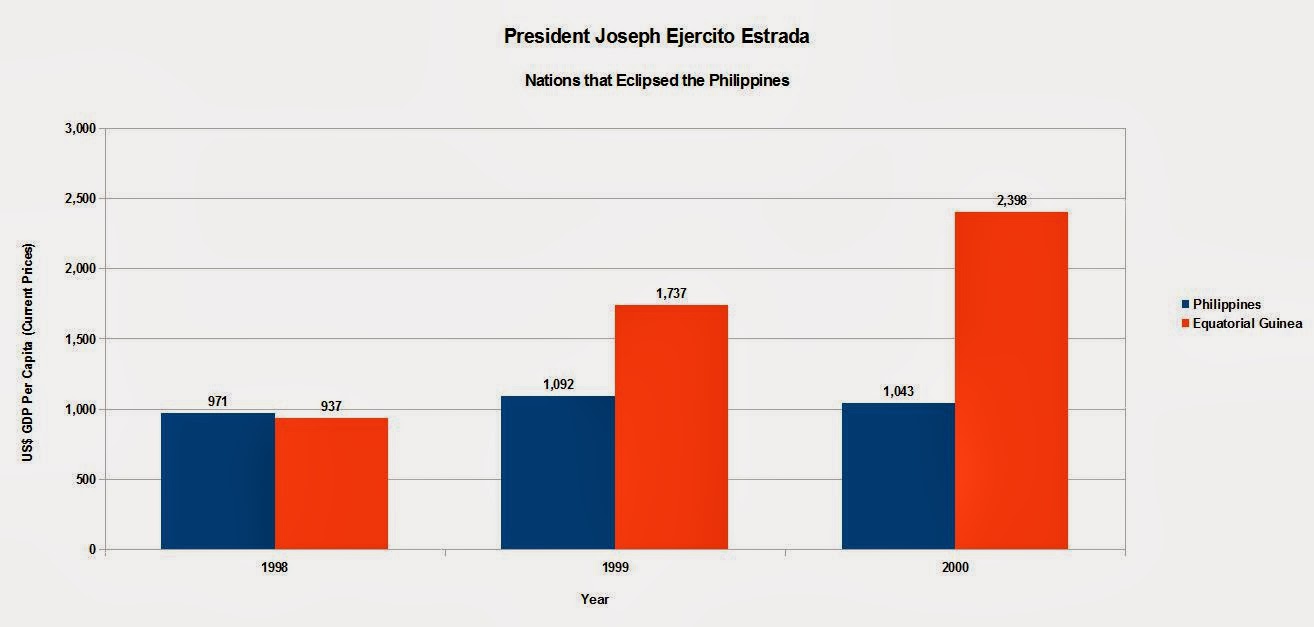
President Joseph Ejercito Estrada

Despite being ousted for corruption in 2001, President Estrada's economic tenure was at par with his predecessor Ramos, at least in terms of per capita GDP growth rates (1.28% CAGR), during his short tenure as our nation's President.

During his abbreviated term, one nation overtook the Philippines in terms of nominal GDP per capita: Equatorial Guinea (1999).


In terms of constant 2005 US $ GDP per capita, it was China (1999).


China is a special case, it has grown so fast in such a short time.  In 1961, its nominal GDP per capita was $76, while Philippines nominal GDP per capita, at $267, was 3.5 times larger.  For a long time, the thought that China could catch up with the Philippines was utterly inconceivable.  Today, China's nominal GDP per capita stands at $6,091 - 2.35 times the Philippines nominal GDP per capita of $2,587!


President Gloria Macagal Arroyo

At a per capita GDP CAGR of 3.07% (in constant 2005 US $), GMA's economic performance was more than 70% better than her dad's economic performance of 1.78% CAGR and more than double that of her dad's four successors.

Still, four other nations fared much better and overtook the Philippines in terms of nominal GDP per capita during her ten-year administration:

  1. Indonesia (2003)
  2. Republic of Congo (2003)
  3. Angola (2004)
  4. Sri Lanka (2005)


In terms of constant 2005 US $ GDP per capita, three other nations surpassed the Philippines:

  1. Armenia (2002)
  2. Bhutan (2002)
  3. Sri Lanka (2002)


President Benigno Aquino III

At a CAGR of 3.42%, Noynoy or PNoy's economic performance in terms of GDP per capita growth rates ranks the highest among all his six predecessor's, including that of his mother's.

 Mongolia, it turns out, grew much faster, overtaking the Philippines in 2010 in nominal terms and in 2011 in constant terms.


The Future:

President Benigno Aquino III: 2013 to 2016

Under PNoy, the country has been growing at a rapid clip and exhibited one of the best economic performances in the ASEAN region in 2013.

But other countries are growing much, much faster and are projected to surpass the Philippines by the end of his term in 2016.  In nominal terms, these countries are:

  1. Bolivia (2013)
  2. Papua New Guinea (2015)


In constant GDP per capita terms, no other countries are expected to surpass the Philippines.


President Jejomar Binay?

Who knows who will become President in 2016?  If history is any guide, Binay, as VP, will take over from Noynoy in 2016, just as Erap did from Ramos in 1998.

Nevertheless, our country is locked in a certain growth trajectory.  And if that growth trajectory holds, two other countries will overtake the Philippines in terms of nominal GDP per capita:

  1. Uzbekistan (2019)
  2. Vietnam (2022)
Yes, Vietnam, our bombed-out ASEAN rival, that only emerged from a debilitating war with the United States in 1975, could overtake the Philippines in nominal GDP per capita terms by 2022!


In constant 2005 US $ GDP per capita, no other country is expected to overtake the Philippines during Binay's (or whoever the next President is) term.


President Kris Aquino?

Projecting way, way into the future is definitely a crap shoot.  And who knows who will be President past Binay, if Binay ever gets elected.  Given our voter's penchant for name recognition, it wouldn't be surprising to see another familiar name as the top honcho of the country.  After all, we've already had two repeats in the last 52 years.  So Kris Aquino is my best bet.

But at our country's current economic path of growth, another bombed-out war-torn ASEAN neighbor will surpass us, at least in nominal terms, by 2024: LAO PDR


Which brings us back to India.  If current economic growth rates hold, even India will surpass us in terms of constant GDP per capita, by 2027.


Source: Worldbank.org

Monday, July 23, 2012

How Leveraged is the Philippine Economy Relative to Other Global Economies?


Today is a doozy.  Spain is imploding and has followed Italy in imposing a short selling ban.  Six countries out of seventeen countries in the Eurozone are already in recession.  Greece and Ireland are in a depression. The US is at or is nearing a recession.  China, the world's second largest economy, is slowing.  So is India.

It's been obvious for some time that large swaths of Europe are in a sovereign debt crisis.  First, Iceland, then Ireland, then Greece and Portugal, and now Spain.  Italy soon to follow.  Quite a bit of blame for the crisis has been placed on the creation of the Euro currency, which allowed the monetary but not fiscal and economic union of the Eurozone countries, resulting in economic imbalances between those countries and the rest of the world.  Quite a bit of blame has also been placed on the financial leverage of those economies.  Greece, which recently had the largest debt restructuring of a sovereign nation and whose debtholders experienced a 75% haircut, will, if all goes well, still have a debt to GDP ratio of 120% by 2020!

So all this brings to mind the question: How leveraged is the Philippine economy relative to other global economies?  Are we the next Greece or Spain.  Based on the latest available data, we are at or below the global average.

With a Public Debt to GDP Ratio of 48.89% as of 2009, we are slightly above the global average of 47.90%.


Global Economies
Public Debt
As % of GDP
Year 2009


Public Debt
Country(% of GDP)
Liberia224.13
Japan217.60
Guinea-Bissau163.31
Lebanon147.97
Congo, Dem. Rep. of138.26
Jamaica137.44
Eritrea134.97
Seychelles127.34
Grenada122.30
Antigua and Barbuda118.26
Italy115.77
Greece115.16
Singapore109.98
Barbados105.36
Iceland99.87
Belgium96.80
Dominica85.29
Sri Lanka85.27
United States84.26
Belize81.42
Nicaragua81.28
Sudan80.60
Hungary78.26
France78.07
India77.69
Israel77.57
Portugal76.30
Egypt76.18
Bhutan74.74
Germany73.51
Cape Verde70.76
Brazil68.90
Malta68.66
United Kingdom68.49
Austria67.11
Ghana66.48
Sao Tome and Principe65.78
Ireland65.53
Cote d'Ivoire65.01
Netherlands61.77
Lao People's Democratic Republic61.64
Jordan61.39
Uruguay60.65
Guyana60.53
Albania59.51
Argentina59.02
Gambia, The58.29
Congo, Republic of57.59
Pakistan57.29
Comoros56.93
Cyprus56.22
Malaysia55.38
Togo55.22
Cameroon54.06
Fiji53.50
Spain53.10
Burundi52.28
Yemen, Republic of51.04
Poland50.92
Mauritius49.28
Kenya49.17
Vietnam49.04
Philippines48.89
El Salvador48.55
Morocco47.71
Malawi45.51
Turkey45.50
Lesotho45.35
Mexico44.94
Thailand44.22
Finland43.90
Bangladesh43.48
Tunisia42.78
Tanzania42.76
Sweden41.63
Denmark41.45
Bahamas, The41.26
Armenia40.63
Bolivia40.54
Panama39.87
Djibouti39.53
Nepal39.39
Switzerland39.02
Angola38.28
Tonga38.25
Georgia37.38
Qatar36.70
Venezuela36.38
Trinidad and Tobago35.45
Croatia35.41
Bosnia and Herzegovina35.37
Czech Republic35.34
Colombia35.19
Ukraine34.64
Madagascar33.74
Latvia32.83
Korea, Republic of32.56
Senegal31.96
Chad31.41
South Africa30.84
Romania29.91
Lithuania29.46
Slovenia29.38
Mozambique29.31
Cambodia28.75
Indonesia28.60
Dominican Republic28.44
Solomon Islands28.28
Costa Rica28.02
Burkina Faso27.86
Zambia27.67
Moldova27.56
Benin27.52
Peru27.38
Syrian Arab Republic27.32
United Arab Emirates27.12
Central African Republic26.90
Bahrain26.58
New Zealand26.16
Gabon26.07
Belarus25.15
Haiti24.77
Mali23.93
Honduras23.68
Guatemala22.96
Uganda22.22
Iran, Islamic Republic of21.58
Macedonia, former Yugoslav Republic of20.82
Suriname20.35
China, People's Republic of18.59
Paraguay18.04
Australia17.63
Luxembourg16.46
Bulgaria16.06
Saudi Arabia15.97
Niger15.78
Namibia15.74
Nigeria15.49
Botswana14.96
Ecuador14.67
Swaziland14.66
Kuwait14.33
Azerbaijan12.11
Kazakhstan10.93
Russian Federation10.88
Hong Kong SAR10.22
Oman7.75
Estonia7.15
Chile6.21
Maldives0.00
Montenegro0.00
Vanuatu0.00
Mauritania0.00
Serbia0.00
Samoa0.00
Papua New Guinea0.00
Brunei Darussalam0.00
Mongolia0.00
Kosovo0.00
Sierra Leone0.00
Afghanistan, Islamic Rep. of0.00
Global Average47.90


Source: www.imf.org


With Private Debt to GDP Ratio of 48.70% as of 2009, we are way below the global average of 72.18%.


Global Economies
Private Debt
As % of GDP
Year 2009


Private Debt
Country(% of GDP)
Japan327.80
Cyprus302.90
United States234.90
United Kingdom229.20
Spain229.10
Netherlands224.10
Ireland223.80
Denmark221.90
Portugal195.10
Switzerland193.10
Luxembourg189.80
South Africa184.20
Iceland182.80
Hong Kong SAR167.80
Lebanon163.10
Malta157.40
New Zealand154.20
China, People's Republic of145.10
Liberia144.30
Sweden144.10
Australia143.70
Italy141.60
Austria140.90
Fiji139.60
Malaysia137.40
Thailand137.00
Barbados136.30
Germany133.10
France128.80
Vietnam123.00
Belgium118.80
Greece115.60
Eritrea113.10
Korea, Republic of109.40
Mauritius106.80
Estonia105.40
Jordan104.60
Bahamas, The102.70
Morocco100.80
Antigua and Barbuda98.00
Finland98.00
United Arab Emirates97.50
Singapore97.20
Brazil95.80
Latvia94.30
Chile93.50
Slovenia93.40
Ukraine88.60
Grenada87.40
Kuwait86.80
Maldives86.50
Israel85.90
Bahrain84.60
Panama83.80
Hungary81.40
Cape Verde78.10
Croatia76.40
Qatar76.20
Montenegro76.20
Egypt75.10
Belize73.00
India70.40
Lithuania70.00
Bulgaria69.60
Nepal69.10
Tunisia68.30
Albania68.00
Nicaragua66.70
Turkey63.00
Vanuatu61.60
Colombia61.50
Poland61.40
Czech Republic60.50
Bangladesh60.40
Jamaica57.90
Honduras54.70
Costa Rica54.60
Kazakhstan54.60
Bosnia and Herzegovina52.90
Mauritania52.90
Romania52.70
Bolivia49.50
Guyana49.10
Dominica48.70
Philippines48.70
Pakistan48.40
Serbia48.00
Samoa46.50
Namibia46.00
El Salvador45.40
Seychelles44.30
Mexico43.70
Syrian Arab Republic43.60
Macedonia, former Yugoslav Republic of43.50
Tonga43.20
Kenya43.10
Moldova41.40
Oman41.30
Dominican Republic40.60
Sri Lanka39.60
Guatemala39.20
Papua New Guinea39.00
Iran, Islamic Republic of37.20
Indonesia37.00
Nigeria36.90
Solomon Islands35.10
Belarus34.10
Russian Federation33.70
Georgia32.90
Djibouti32.30
Trinidad and Tobago32.30
Brunei Darussalam32.20
Malawi32.00
Bhutan30.90
Paraguay30.20
Mongolia29.60
Angola29.20
Uruguay28.80
Ghana28.70
Gambia, The28.60
Argentina28.00
Togo27.30
Senegal26.60
Suriname26.20
Venezuela25.90
Sao Tome and Principe25.40
Ecuador24.40
Haiti23.60
Burundi23.40
Cote d'Ivoire23.00
Mozambique22.60
Azerbaijan22.50
Lao People's Democratic Republic20.80
Comoros20.50
Yemen, Republic of20.30
Sudan20.00
Armenia20.00
Benin19.30
Cambodia19.10
Peru18.90
Zambia18.50
Tanzania18.10
Central African Republic15.30
Burkina Faso14.80
Kosovo14.10
Niger12.50
Madagascar11.80
Uganda11.80
Sierra Leone10.90
Mali10.70
Swaziland9.10
Cameroon8.30
Chad8.00
Gabon7.60
Congo, Dem. Rep. of7.30
Guinea-Bissau4.90
Afghanistan, Islamic Rep. of3.40
Saudi Arabia0.60
Botswana-1.00
Lesotho-14.70
Congo, Republic of-15.90
Global Average72.18


Source: www.worldbank.org, www.imf.org


In terms of our Total Debt to GDP Ratio, the Philippines has a Total Debt to GDP Ratio of 97.59% as of 2009, far below the global average of 120.07%.


Global Economies


Public Debt, Private Debt, and Total Debt


As % of GDP


Year 2009


Public DebtPrivate DebtTotal Debt
Country(% of GDP)(% of GDP)(% of GDP)
Japan217.60327.80545.40
Liberia224.13144.30368.43
Cyprus56.22302.90359.12
United States84.26234.90319.16
Lebanon147.97163.10311.07
United Kingdom68.49229.20297.69
Ireland65.53223.80289.33
Netherlands61.77224.10285.87
Iceland99.87182.80282.67
Spain53.10229.10282.20
Portugal76.30195.10271.40
Denmark41.45221.90263.35
Italy115.77141.60257.37
Eritrea134.97113.10248.07
Barbados105.36136.30241.66
Switzerland39.02193.10232.12
Greece115.16115.60230.76
Malta68.66157.40226.06
Antigua and Barbuda118.2698.00216.26
Belgium96.80118.80215.60
South Africa30.84184.20215.04
Grenada122.3087.40209.70
Austria67.11140.90208.01
Singapore109.9897.20207.18
France78.07128.80206.87
Germany73.51133.10206.61
Luxembourg16.46189.80206.26
Jamaica137.4457.90195.34
Fiji53.50139.60193.10
Malaysia55.38137.40192.78
Sweden41.63144.10185.73
Thailand44.22137.00181.22
New Zealand26.16154.20180.36
Hong Kong SAR10.22167.80178.02
Vietnam49.04123.00172.04
Seychelles127.3444.30171.64
Guinea-Bissau163.314.90168.21
Jordan61.39104.60165.99
Brazil68.9095.80164.70
China, People's Republic of18.59145.10163.69
Israel77.5785.90163.47
Australia17.63143.70161.33
Hungary78.2681.40159.66
Mauritius49.28106.80156.08
Belize81.4273.00154.42
Egypt76.1875.10151.28
Cape Verde70.7678.10148.86
Morocco47.71100.80148.51
India77.6970.40148.09
Nicaragua81.2866.70147.98
Congo, Dem. Rep. of138.267.30145.56
Bahamas, The41.26102.70143.96
Korea, Republic of32.56109.40141.96
Finland43.9098.00141.90
Dominica85.2948.70133.99
Albania59.5168.00127.51
Latvia32.8394.30127.13
Sri Lanka85.2739.60124.87
United Arab Emirates27.1297.50124.62
Panama39.8783.80123.67
Ukraine34.6488.60123.24
Slovenia29.3893.40122.78
Qatar36.7076.20112.90
Estonia7.15105.40112.55
Poland50.9261.40112.32
Croatia35.4176.40111.81
Bahrain26.5884.60111.18
Tunisia42.7868.30111.08
Guyana60.5349.10109.63
Turkey45.5063.00108.50
Nepal39.3969.10108.49
Pakistan57.2948.40105.69
Bhutan74.7430.90105.64
Bangladesh43.4860.40103.88
Kuwait14.3386.80101.13
Sudan80.6020.00100.60
Chile6.2193.5099.71
Lithuania29.4670.0099.46
Philippines48.8948.7097.59
Colombia35.1961.5096.69
Czech Republic35.3460.5095.84
Ghana66.4828.7095.18
El Salvador48.5545.4093.95
Kenya49.1743.1092.27
Sao Tome and Principe65.7825.4091.18
Bolivia40.5449.5090.04
Uruguay60.6528.8089.45
Mexico44.9443.7088.64
Bosnia and Herzegovina35.3752.9088.27
Cote d'Ivoire65.0123.0088.01
Argentina59.0228.0087.02
Gambia, The58.2928.6086.89
Maldives0.0086.5086.50
Bulgaria16.0669.6085.66
Costa Rica28.0254.6082.62
Romania29.9152.7082.61
Togo55.2227.3082.52
Lao People's Democratic Republic61.6420.8082.44
Tonga38.2543.2081.45
Honduras23.6854.7078.38
Malawi45.5132.0077.51
Comoros56.9320.5077.43
Montenegro0.0076.2076.20
Burundi52.2823.4075.68
Djibouti39.5332.3071.83
Yemen, Republic of51.0420.3071.34
Syrian Arab Republic27.3243.6070.92
Georgia37.3832.9070.28
Dominican Republic28.4440.6069.04
Moldova27.5641.4068.96
Trinidad and Tobago35.4532.3067.75
Angola38.2829.2067.48
Indonesia28.6037.0065.60
Kazakhstan10.9354.6065.53
Macedonia, former Yugoslav Republic of20.8243.5064.32
Solomon Islands28.2835.1063.38
Cameroon54.068.3062.36
Venezuela36.3825.9062.28
Guatemala22.9639.2062.16
Namibia15.7446.0061.74
Vanuatu0.0061.6061.60
Tanzania42.7618.1060.86
Armenia40.6320.0060.63
Belarus25.1534.1059.25
Iran, Islamic Republic of21.5837.2058.78
Senegal31.9626.6058.56
Mauritania0.0052.9052.90
Nigeria15.4936.9052.39
Mozambique29.3122.6051.91
Oman7.7541.3049.05
Haiti24.7723.6048.37
Paraguay18.0430.2048.24
Serbia0.0048.0048.00
Cambodia28.7519.1047.85
Benin27.5219.3046.82
Suriname20.3526.2046.55
Samoa0.0046.5046.50
Peru27.3818.9046.28
Zambia27.6718.5046.17
Madagascar33.7411.8045.54
Russian Federation10.8833.7044.58
Burkina Faso27.8614.8042.66
Central African Republic26.9015.3042.20
Congo, Republic of57.59-15.9041.69
Chad31.418.0039.41
Ecuador14.6724.4039.07
Papua New Guinea0.0039.0039.00
Mali23.9310.7034.63
Azerbaijan12.1122.5034.61
Uganda22.2211.8034.02
Gabon26.077.6033.67
Brunei Darussalam0.0032.2032.20
Lesotho45.35-14.7030.65
Mongolia0.0029.6029.60
Niger15.7812.5028.28
Swaziland14.669.1023.76
Saudi Arabia15.970.6016.57
Kosovo0.0014.1014.10
Botswana14.96-1.0013.96
Sierra Leone0.0010.9010.90
Afghanistan, Islamic Rep. of0.003.403.40
Global Average47.9072.18120.07


Source: www.worldbank.org, www.imf.org


The Philippines is totally not out of the woods yet.  Since at least 60% of the global economy is experiencing a slowdown, there's a strong chance that the Philippine economy will experience a slowdown as well in the not too distant future. Let's not forget that the economies of Iceland, Ireland, and Spain were brought down by a banking crisis.  Iceland's banking sector was huge relative to the size of its economy and when the financial crisis of 2008 struck, it's banking system collapsed as well.  Both Ireland and Spain experienced massive real estate bubbles.  The their subsequent bursting led to an explosion of non-performing loans in the banking system.  The ratio of Philippine NPLs to GDP was only 1.61% as of 2011, well below the global average of 5.56% for the same period.  Lest we get too complacent, we have to remember that Ireland's NPL to GDP ratio was only 1.56% in 2007.  A year later, during the 2008 financial crisis, it was 5.39%.  The following year, it nearly quadrupled to 20.14% and has remained above 20% ever since.  We could suffer the same fate, if we're not too careful.


Global Economies
NPL as a % of GDP
2007 to 2010


Country name20072008200920102011
Iceland0.00%0.00%82.63%66.59%56.92%
Ireland1.56%5.39%20.14%20.06%20.76%
Cyprus0.00%10.08%13.63%17.68%20.14%
Greece5.12%5.80%8.90%15.13%17.08%
Latvia0.72%3.22%15.47%17.02%14.59%
Malta6.94%6.91%8.81%11.22%11.62%
Ukraine1.83%3.20%12.14%12.16%11.30%
Lithuania0.60%2.95%13.51%12.73%10.98%
United States3.42%6.66%12.68%11.41%10.97%
Kazakhstan0.00%2.76%11.58%10.81%10.68%
Serbia0.00%4.55%7.44%9.73%10.23%
Croatia3.44%3.65%5.96%9.21%10.18%
Albania2.11%4.36%7.14%9.33%9.95%
Bulgaria1.17%1.61%4.45%8.44%9.64%
Denmark1.23%2.52%7.32%8.83%9.06%
Hungary1.74%2.43%5.45%7.92%7.87%
Romania0.91%1.33%4.16%6.53%7.37%
Bosnia and Herzegovina1.86%2.08%3.12%7.41%6.75%
Pakistan3.68%5.59%6.10%6.81%6.65%
Lebanon18.34%12.62%9.79%7.07%6.60%
Portugal2.32%3.20%5.46%6.90%6.53%
Netherlands0.00%3.33%7.17%5.94%5.70%
Morocco7.19%5.92%5.54%4.66%5.59%
Poland2.41%2.69%4.91%5.59%5.56%
Thailand10.40%7.44%7.26%5.28%5.28%
Ghana1.47%2.15%4.65%5.00%4.76%
Estonia0.45%1.82%5.48%5.34%4.46%
South Africa2.73%6.78%10.87%10.58%4.42%
Macedonia, FYR2.51%2.77%3.87%4.37%4.25%
Moldova1.49%2.07%6.79%4.95%4.23%
Bhutan0.00%0.00%2.10%2.11%3.89%
Malaysia7.37%5.52%4.95%4.49%3.83%
Czech Republic1.39%1.78%3.15%3.90%3.81%
Austria2.79%2.49%3.24%3.85%3.65%
Georgia0.81%4.19%5.86%4.15%3.53%
Russian Federation0.61%0.91%3.20%3.15%3.26%
Australia0.82%1.86%2.87%3.25%3.21%
Brazil2.77%3.00%4.02%2.95%3.15%
Mauritius2.48%2.16%3.52%3.11%3.10%
Kenya3.94%3.59%3.40%3.21%2.81%
Seychelles1.81%1.34%1.68%2.85%2.60%
Sierra Leone0.20%1.32%1.16%2.87%2.58%
Chile0.68%0.93%2.71%2.40%2.40%
Turkey1.77%2.00%3.53%2.64%2.15%
Colombia1.68%2.16%2.46%1.90%1.91%
El Salvador0.98%1.30%1.68%1.74%1.74%
Philippines*2.80%2.13%2.00%1.87%1.61%
China7.92%2.90%2.32%1.61%1.60%
Hong Kong SAR, China1.00%1.50%2.68%1.59%1.48%
Armenia0.29%0.75%0.96%0.77%1.43%
Dominican Republic1.57%1.33%1.62%1.15%1.21%
Costa Rica0.58%0.81%1.09%0.96%1.17%
Indonesia1.66%1.18%1.22%0.95%1.12%
Belarus0.51%0.56%1.43%1.59%1.07%
Panama1.23%1.46%1.17%0.96%1.01%
Namibia1.36%1.36%1.24%1.06%0.98%
Bolivia3.00%2.08%1.73%1.09%0.95%
Ecuador0.84%0.76%1.00%0.92%0.95%
Mexico0.89%1.12%1.22%0.90%0.91%
Oman1.05%0.61%1.45%1.24%0.87%
Guatemala0.61%0.84%1.06%0.81%0.78%
Venezuela, RB0.24%0.38%0.78%0.77%0.73%
Paraguay0.25%0.28%0.48%0.42%0.62%
Mozambique0.26%0.26%0.41%0.49%0.57%
Luxembourg0.73%1.10%1.33%0.37%0.51%
Finland0.26%0.35%0.59%0.60%0.50%
Argentina0.77%0.66%0.84%0.53%0.47%
Peru0.43%0.42%0.51%0.47%0.47%
Uganda0.23%0.27%0.50%0.35%0.47%
Lesotho-0.55%-0.74%-0.54%-0.23%0.02%
Montenegro2.50%6.34%10.29%14.26%NA
Italy5.90%6.47%9.91%12.08%NA
Spain1.78%6.01%9.39%10.76%NA
Tunisia11.33%10.17%9.02%8.93%NA
United Kingdom1.69%3.42%8.02%8.90%NA
Jordan4.69%4.66%7.01%7.89%NA
Egypt, Arab Rep.16.23%11.50%10.06%7.63%NA
Nigeria1.92%0.08%10.74%6.14%NA
Kuwait2.61%4.44%9.98%5.87%NA
Japan4.17%5.12%6.23%5.87%NA
Senegal4.54%4.26%4.97%5.86%NA
France3.29%3.48%4.64%5.58%NA
United Arab Emirates1.74%1.68%4.19%5.17%NA
Slovenia1.47%1.57%2.15%3.51%NA
Belgium1.34%1.92%3.68%3.28%NA
Korea, Rep.0.69%1.20%1.31%1.96%NA
India1.52%1.56%1.62%1.75%NA
Singapore1.04%1.40%2.33%1.51%NA
Swaziland0.49%0.14%0.74%1.38%NA
Gabon0.22%0.52%0.55%1.00%NA
Uruguay0.27%0.35%0.35%0.32%NA
Germany3.37%3.67%4.39%NANA
Sweden0.78%1.35%2.88%NANA
Israel1.31%1.35%1.20%NANA
Switzerland0.55%0.91%0.77%NANA
Kosovo0.00%0.39%0.62%NANA
Global Average2.28%2.78%5.48%5.76%5.56%


* Estimated 2011
Source: www.worldbank.org, www.bsp.gov.ph