
In her first testimony to the House Financial Services Committee as Chairman of the Federal Reserve, Janet Yellen said that:
"...recovery in the labor market is far from complete...Those out of a job for more than six months continue to make up an unusually large fraction of the unemployed and the number of people who are working part-time but would prefer a full-time job remains very high...These observations underscore the importance of considering more than the unemployment rate when evaluating the condition of the U.S. labor market."
Although the US economy is a year or two away from recovering the millions in jobs lost since the economic recession began, the rate of job growth has been anemic and has not kept pace with population growth (See chart from the blog Calculated Risk below).

The sharp drop in the Unemployment Rate, from an average annual peak of 9.9% in 2009 to only 6.6% as of January 2014, was mainly a result of people dropping out of the labor force altogether. The Labor Force Participation Rate currently stands at 63% as of January 2014, a level not seen since the late 1970s when many women started entering the workforce in droves.
The Civilian Employment to Population Ratio (E/P Ratio), which is a better indicator of true labor market conditions because it includes people who have dropped out of the labor force, has barely budged from its lows of 58.3% as of 2009 and 2010.

But how have these measures played out on a state-by-state basis? Both Labor Force Participation and Unemployment rates have dropped across the board on a state-by-state basis and with a few exceptions, still continue to drop. But in terms of the Civilian Employment to Population Ratio (E/P Ratio), some states have bottomed out and are starting to come off their lows.
Uptrend
The states that have bottomed out are as follows:

The E/P Ratio for the golden state bottomed out at 56% in 2011 and now stands at 57.2% as of January 2014.
2. District of Columbia

DC's E/P Ratio also bottomed out at 60.9% in 2011 and now stands at 63.4% as of December 2013.
3. Florida

Florida's E/P Ratio bottomed out at 54.5% in 2010 and now stands at 55.9% as of December 2013.
Florida's E/P Ratio bottomed out at 54.4% in 2010 and now stands at 56.2% as of January 2014.
4. Hawaii

Hawaii's E/P Ratio bottomed out at 57.7% in 2012 and now stands marginally higher at 58.2% as of January 2014.
5. Idaho

Idaho's E/P Ratio bottomed out at 59.5% in 2011 and now stands at 60.3% as of January 2014.
6. Indiana

Indiana's E/P Ratio bottomed out at 57.4% in 2010 and now stands at 58.7% as of January 2014.
7. Iowa

Iowa's E/P Ratio flattened out at 66% in 2011 and now stands at 66.5% as of January 2014.
8. Louisiana

Louisiana's E/P Ratio bottomed out at 55.1% in 2011 and now stands at 56.2% as of January 2014.
9. Maine

Maine's E/P Ratio bottomed out at 60.1% in 2010 and now stands at 61.2% as of January 2014.
10. Michigan

Michigan's E/P Ratio bottomed out at 53.6% in 2010 and now stands at 55.3% as of January 2014.
11. Minnesota

Minnesota's E/P Ratio bottomed out at 66.5% in 2009 and has moved 67% as of January 2014.
12. Missouri

Missouri's E/P Ratio bottomed out at 59.4% in 2009 and now stands at 60.4% as of January 2014.
13. Montana

Montana's E/P Ratio bottomed out at 59.4% in 2011 and now stands at 60.5% as of January 2014.
14. Nebraska

Nebraska's E/P Ratio bottomed out at 68.0% in 2010 and now stands at 69.0% as of January 2014.
15. New Mexico

New Mexico's E/P Ratio bottomed out at 54.0% in 2011 and now stands at 54.2% as of January 2014.
16. New York

New York's E/P Ratio bottomed out at 56.6% as of 2011 and now stands at 56.9% as of January 2014.
17. North Carolina

North Carolina's E/P Ratio bottomed out at 56.5% in 2011 and now stands at 57.0% as of January 2014.
18. Ohio

Ohio's E/P Ratio bottomed out at 58.6% in 2010 and now stands at 59.1% as of January 2014.
19. Oklahoma

Oklahoma's E/P Ratio bottomed out at 58.3% in 2011 and now stands at 58.9% as of January 2014.
20. Oregon

Oregon's E/P Ratio bottomed out at 56.7% in 2013 and now stands at 56.9% as of January 2014.
21. Pennsylvania

Pennsylvania's E/P Ratio bottomed out at 58.2% in 2010 and now stands at 58.8% as of January 2014.
22. South Carolina

South Carolina's E/P Ratio bottomed out at 54% in 2010 and now stands at 54.4% as of January 2014.
23. Texas

Texas E/P Ratio bottomed out at 60.7% in 2011 and now stands at 61.2% as of January 2014.
24. Utah

Utah's E/P Ratio bottomed out at 63.3% in 2011 and now stands at 66.4% as of January 2014.
25. Virginia

Virginia's E/P Ratio bottomed out at 62.6% in 2010 and now stands at 62.9% as of January 2014.
26. Wisconsin

Wisconsin's E/P Ratio bottomed out at 63.5% in 2012 and now stands at 63.8% as of January 2014.
27. Wyoming

Wyoming's E/P Ratio bottomed out at 64.9% in 2012 and now stands at 65.3% as of January 2014.
Sideways
The E/P Ratio of a few states have moved sideways off their lows. The States that are going sideways are as follows:
1. Alaska

Alaska's E/P Ratio bottomed out at 63.4% in 2013 and has remained flat at 63.4% as of January 2014.
2. Arkansas

Arkansas' E/P Ratio bottomed out at 53.9% in 2013 and has remained there till January 2014.
3. Delaware

Delaware's E/P ratio bottomed out at 56.7% in 2013 and has gone slightly sideways. It remains marginally higher at 56.8% as of January 2014.
4. Georgia

Georgia's E/P Ratio bottomed out at 57.8% in 2010 but has risen only slightly higher to 57.9% as of January 2014.
5. Illionois

Illinois E/P Ratio bottomed out at 59.4% in 2013 and has risen only slightly higher to 59.6% as of January 2014.
6. Kansas

Kansas E/P Ratio bottomed out at 64.3% in 2013 and has remained there until January 2014.
7. Nevada

Nevada's E/P Ratio bottomed out at 57.2% in 2013 and has risen slightly to 57.3% as of January 2014.
8. New Hampshire

New Hampshire's E/P Ratio bottomed out at 65.6% in 2013 and has risen slightly to 65.7% as of January 2014.
9. South Dakota

South Dakota's E/P Ratio bottomed out at 67.2% in 2013 and has remained at that level as of January 2014.
10. Vermont

Vermont's E/P Ratio bottomed out at 65.5% in 2013 and has remained at that level as of January 2014.
11. Wisconsin

Wisconsin's E/P Ratio bottomed out at 63.5% in 2012 and has risen slightly to 63.8% as of January 2014.
Downtrend
The E/P Ratio of many states are still on a marked downtrend. Those states that are still on a downtrend are as follows:
1. Alabama

Alabama's E/P Ratio hit a new low of 52.7% as of January 2014.
2. Arizona

Arizona's E/P Ratio hit a new low of 54.3% as of January 2014.

Colorado's E/P Ratio hit a new low of 63.1% as of January 2014.
4. Connecticut

Connecticut's E/P Ratio hit a new low of 60.0% as of January 2014.
5. Kentucky

Kentucky's E/P Ratio hit a new low of 55.3% as of January 2014.
6. Maryland

Maryland's E/P Ratio hit a new low of 62.8% as of January 2014.
7. Massachussets

Massachussets' E/P Ratio hit a new low of 60.0% as of January 2014.
8. Mississipi

Mississipi's E/P Ratio hit a new low of 51.7% as of January 2014.
9. New Jersey

New Jersey's E/P Ratio hit a new low of 59.1% as of January 2014.
10. North Dakota

North Dakota's E/P Ratio stands at 69.1% as of January 2014.
11. Rhode Island
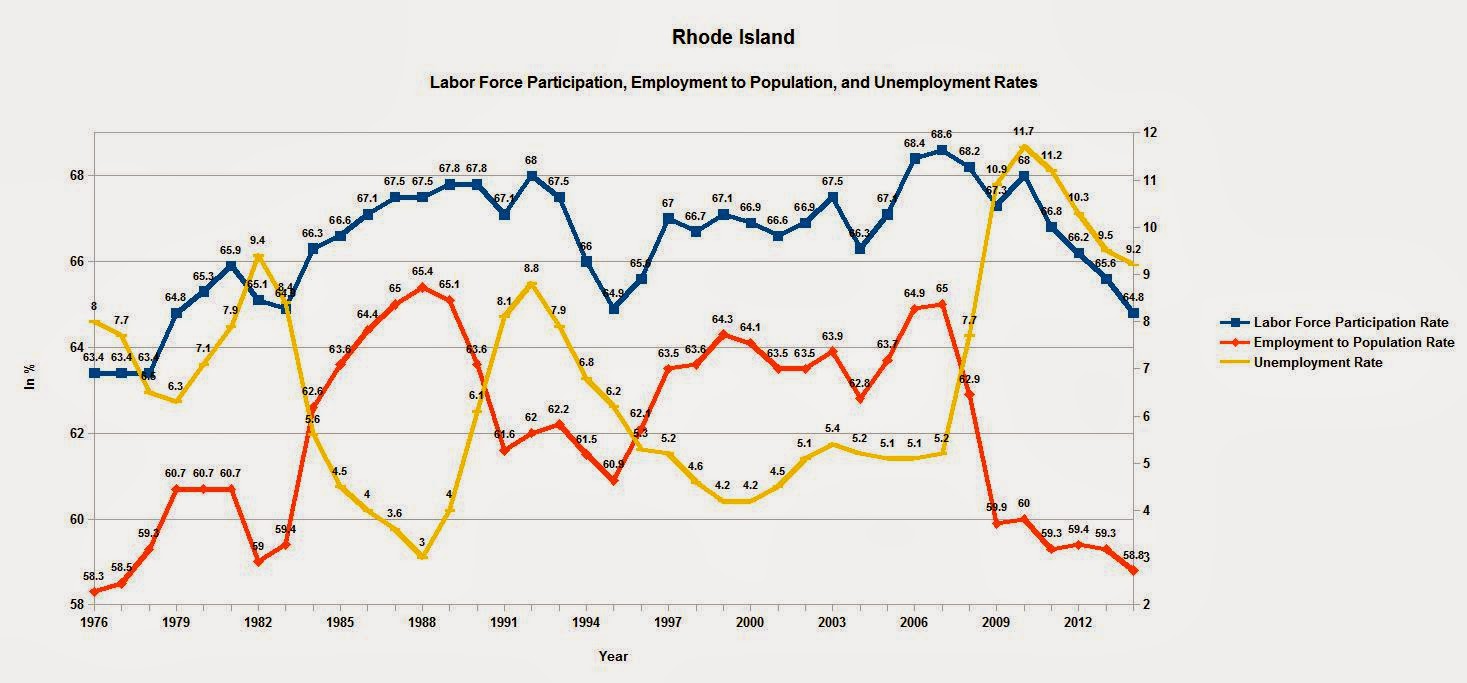
Rhode Island's E/P Ratio hit a new low of 58.8% as of January 2014.
12. Tennessee

Tennessee's E/P Ratio hit a new low of 55.3% as of January 2014.
13. Washington

Washington's E/P Ratio hit a new low of 59.0% as of January 2014.